ETF Tracker Newsletter For November 11, 2016

Ulli ETF Tracker Contact

ETF Tracker StatSheet

————————————————————-

https://theetfbully.com/2016/11/weekly-statsheet-for-the-etf-tracker-newsletter-updated-through-11102016/

————————————————————

Market Commentary

A WILD RIDE: GOLD CRASHES, BONDS LOSE OVER $1 TRILLION IN SECOND WORST WEEK EVER

fri-pic

[Chart courtesy of MarketWatch.com]
  1. Moving the Markets

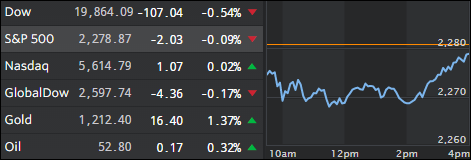
It was wild week in the markets, and it continued today despite the bond market being closed. Besides the Dow making a new all-time high, and other indexes joining to varying degrees in the Trump rally, reaction in other assets classes was anything but reassuring.

ZH adds some color:

Over 85,000 gold futures contracts (over $10 billion) traded as gold plunged from $1260 to $1230 as US equity markets opened. This is the worst 7-day run for gold since November as Dec rate hikes were jawboned more likely.

Down 5 days in a row, today’s crash has dumped the precious metal to its lowest price since June…

Of course, this makes perfect sense, as EM FX collapses, inflation expectations spike most in years, and Trump’s debt-funded fiscal spending plan means more QE.

 For the week, investors had to swallow over $1 trillion on bond losses as interest rates spiked, which was the worst decline since the 1981 bond market crash.

Despite the Dow making new all-time highs this week, and the S&P hovering within striking distance of doing the same, Emerging Markets collapsed and several Asian countries had to intervene in their currencies to stem the sell-off.

This week’s market action was anything but orderly and had “disconnect” written all over it. The chart of the Dow looks like a “blow-off” top has been established, and I can’t help but think that if bond yields continue rise next week, domestic equities will be negatively affected.

Read More

Weekly StatSheet For The ETF Tracker Newsletter – Updated Through 11/10/2016

Ulli ETF StatSheet Contact

ETF Data updated through Thursday, November 10, 2016

TOC082516

Methodology/Use of this StatSheet:

  1. From the universe of over 1,800 ETFs, I have selected only those with a trading volume of over $5 million per day (HV ETFs), so that liquidity and a small bid/ask spread are assured.
  2. Trend Tracking Indexes (TTIs)

Buy or Sell decisions for Domestic and International ETFs (section 1 and 2), are made based on the respective TTI and its position either above or below its long-term M/A (Moving Average). A crossing of the trend line from below accompanied by some staying power above constitutes a “Buy” signal. Conversely, a clear break below the line constitutes a “Sell” signal. Additionally, I use a 7.5% trailing stop loss on all positions in these categories to control downside risk.

  1. All other investment arenas do not have a TTI and should be traded based on the position of the individual ETF relative to its own respective trend line (%M/A). That’s why those signals are referred to as a “Selective Buy.” In other words, if an ETF crosses its own trend-line to the upside, a “Buy” signal is generated. Since these areas tend to be more volatile, I recommend a wider trailing sell stop of 7.5% -10% depending on your risk tolerance.

If you are unfamiliar with some of the terminology, please see Glossary of Terms and new subscriber information in section 9.


  1. DOMESTIC EQUITY ETFs: BUY — since 4/4/2016

tti

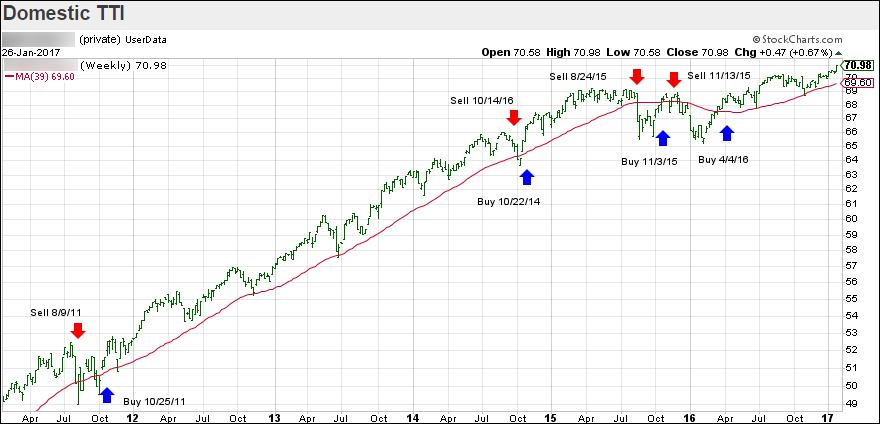
Our main directional indicator, the Domestic Trend Tracking Index (TTI-green line in the above chart) is positioned above its long-term trend line (red) by +0.80% after having generated a new Domestic Buy signal effective 4/4/2016 as posted.

Read More

A Split Market: Dow Hits Record High, Nasdaq Dumps, Bond Bloodbath Continues

Ulli Market Commentary Contact

thur-pic

[Chart courtesy of MarketWatch.com]
  1. Moving the Markets

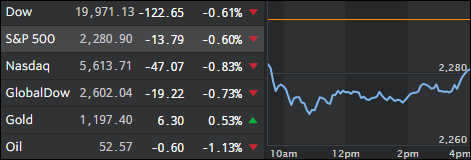
It was a market of extremes. While the Dow managed to hit an all-time high, powered predominantly by only 4 stocks in its index, the Nasdaq headed south while the S&P meandered but managed to close in the green by +0.20%.

Emerging markets (ILF) got pounded at the rate of -7.17% while bonds around the world got clobbered again as yields spiked. If that trend continues, it makes me wonder how long equities can avoid being negatively affected, especially if the Fed sticks to his promise of raising rates in December.

Small Caps (SCHA) had a good day and gained +1.20% while on the other end of the spectrum gold miners (GDX), which are very volatile to begin with, got pummeled and lost -7.48%. It seems to me like Wall Street is going through a re-positioning process via asset rotations to better handle the upcoming changes of a Trump administration.

Read More

From Feast To Famine To Feast: Trump Wins, Stock Futures Crash, Massive Rebound Follows

Ulli Market Commentary Contact

wed-pic

[Chart courtesy of MarketWatch.com]
  1. Moving the Markets

It’s hard to put the market action of the past 24 hours into words. As Trump’s election victory became apparent last night, volatility shifted into overdrive and stock futures headed sharply south triggering the “limit down” trading stop after having lost 5%.

For sure, you thought today would have turned into a bloodbath on Wall Street right from the opening. Those were my thoughts as well, and I was prepared to pull the trigger on our equity holdings this morning. However, much to my surprise the markets had recovered and were hovering around the unchanged line before staging a massive rebound rally, which was the best day-after-presidential-election since Reagan in 1980 (hat tip to ZH for this stat).

The bloodbath actually happened in bonds, especially in the 10 year Treasury, whose yield spiked to 2% with a range of almost 40 basis points from low to high, which was the the biggest percentage move in 10-year yields ever. In the end, there was no negative effect on our Trend Tracking Indexes, and we remain in “Buy” mode for the time being.

With bond yields moving higher, without the Fed’s intervention, the question is whether this rally is sustainable or simply position adjustments in the markets to reflect new realities associated with the Trump win. We may see more clarity in this current high volatility environment as things hopefully calm down over the next week or so.

In case you missed it, here the stock futures chart from last night in all its glory showing the massive dump:

Read More

Wall Street Is Betting On A Clinton Win

Ulli Market Commentary Contact

tue-pic

[Chart courtesy of MarketWatch.com]
  1. Moving the Markets

It was one of the worst kept secrets on Wall Street: Traders prefer a Clinton victory. Yesterday’s rally continued today, although far more cautiously, as the investment community sees the former secretary of state as a status quo candidate, a much preferred choice. It implies that alleged stability in the markets, aka the hope that continued support by the Fed to push up values even deeper into bubble territory, will remain business as usual.

Of course, should the traders be right about a Clinton win, the open ended question is as to how long this enthusiasm will last before reality sets in again, as we are facing a flow of worsening economic data points amidst the Fed’s recent “promise” to raise rates in December despite a deteriorating economy.

Much uncertainty awaits the markets, and there is still the possibility that Trump might win. If he does, the “feel good rally” of the past 2 days will disappear in a hurry. But, for right now, all is well on Wall Street with the 9-day losing streak of the S&P 500 having been broken and replaced with a “hope” rally.

Read More

Markets In Rally Mode Thanks To FBI Flip-Flop

Ulli Market Commentary Contact

mon-pic

[Chart courtesy of MarketWatch.com]
  1. Moving the Markets

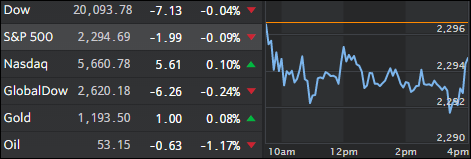
After 9 straight losing sessions, the markets shifted into high gear right out of the starting blocks to stage the best rally in 8 months. The reason was that FBI chief Comey decided that he would not press criminal charges against Hillary Clinton after just having re-opened the case 9 days ago.

This brightened the prospects for a Clinton victory, who is a favorite on Wall Street, because she represents the status quo while Trump as a president would shake up things a bit and the establishment feels unnerved by his views on foreign policy, trade and immigration.

As I posted Friday, the follow through to the downside I was looking for to validate the bearish implication of our Domestic TTI did not happen, so we remain invested until a break below the trend line materializes again. For more detail, please see the TTI data in section 3 below.

Read More