
- Moving the Markets
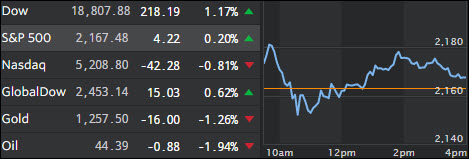
It was a market of extremes. While the Dow managed to hit an all-time high, powered predominantly by only 4 stocks in its index, the Nasdaq headed south while the S&P meandered but managed to close in the green by +0.20%.
Emerging markets (ILF) got pounded at the rate of -7.17% while bonds around the world got clobbered again as yields spiked. If that trend continues, it makes me wonder how long equities can avoid being negatively affected, especially if the Fed sticks to his promise of raising rates in December.
Small Caps (SCHA) had a good day and gained +1.20% while on the other end of the spectrum gold miners (GDX), which are very volatile to begin with, got pummeled and lost -7.48%. It seems to me like Wall Street is going through a re-positioning process via asset rotations to better handle the upcoming changes of a Trump administration.
- ETFs in the Spotlight
In case you missed the announcement and description of this section, you can read it here again.
It features 10 broadly diversified ETFs from my HighVolume list as posted every Monday. Furthermore, they are screened for the lowest MaxDD% number meaning they have been showing better resistance to temporary sell offs than all others over the past year.
Here are the 10 candidates:
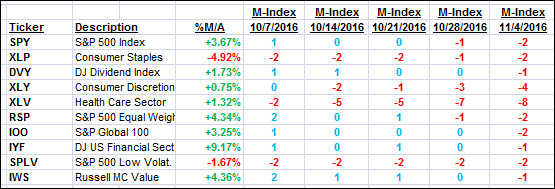
The above table simply demonstrates the magnitude with which some of the ETFs are fluctuating in regards to their positions above or below their respective individual trend lines (%M/A). A break below, represented by a negative number, shows weakness, while a break above, represented by a positive percentage, shows strength.
For hundreds of ETF choices, be sure to reference Thursday’s StatSheet.
Year to date, here’s how the above candidates have fared so far:
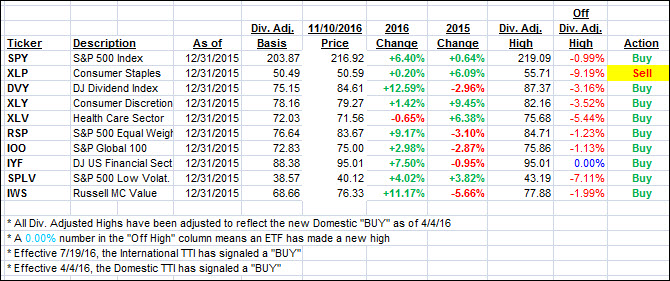
Again, the first table above shows the position of the various ETFs in relation to their respective long term trend lines (%M/A), while the second one tracks their trailing sell stops in the “Off High” column. The “Action” column will signal a “Sell” once the -7.5% point has been taken out in the “Off High” column.
- Trend Tracking Indexes (TTIs)
Our Trend Tracking Indexes (TTIs) were mixed as well with the Domestic one retreating and the International one advancing.
Here’s how we closed 11/10/2016:
Domestic TTI: +0.80% (last close +1.02%)—Buy signal effective 4/4/2016
International TTI: +2.76% (last close +2.55%)—Buy signal effective 7/19/2016
Disclosure: I am obliged to inform you that I, as well as my advisory clients, own some of the ETFs listed in the above table. Furthermore, they do not represent a specific investment recommendation for you, they merely show which ETFs from the universe I track are falling within the guidelines specified.
Contact Ulli