Bond Yields Spike But Major Indexes Crawl Higher

Ulli Market Commentary Contact

thur-pic

[Chart courtesy of MarketWatch.com]
  1. Moving the Markets

Fed chief Yellen was in the spotlight during her congressional testimony at which time she pointed out that the election outcome has not changed the Fed’s plan for a rate increase “relatively soon” and absent any dramatic changes, a gradual pace of hikes thereafter.  Sounds like the same rhetoric we’ve heard all year long.

Living costs have not only surged the most since 2007, but also increased at a faster rate than the Fed’s mandated 2%, which means a hike in rates would sure be justifiable based on this matrix. Especially energy and the overall cost increases associated with housing/shelter rose by 3.5% year over year, hardly a negligible number.

Bond yields spiked again and, as Horseman Capital pointed out sharp yield spikes have preceded every major crisis in the past 20 years. Here’s the chart they are referring to:

Read More

A Pause In The Post-Election Rally

Ulli Market Commentary Contact

wed-pic

[Chart courtesy of MarketWatch.com]
  1. Moving the Markets

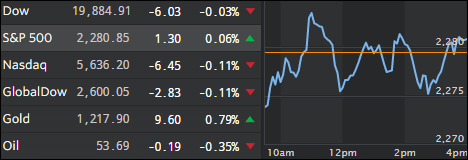
It was a mixed day with the S&P meandering slightly below its unchanged line caused by Wall Street digesting a healthy dose of economic data points. Industrial production tanked again and has now contracted for the 14th straight month, which is its longest non-recessionary streak in 96 years. To look at it another way, this is the biggest 2-year decline since the middle of 2008.

At the same time mortgage applications crashed 30% to 10-month lows, which was not really a surprise considering that mortgage rates surged and approached 4%.

Given that, it came as a total surprise that the December Fed rate-hike odds are now near 100%. Yes, that is not a misprint; even deteriorating economic data don’t matter as the anticipated spending wave to be implemented by the new incoming Trump administration takes priority.

It sure does not make sense when looking at this chart, courtesy of ZH:

Read More

Post Election Updraft Continues

Ulli Market Commentary Contact

tue-pic

[Chart courtesy of MarketWatch.com]
  1. Moving the Markets

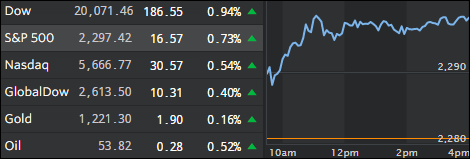
The major indexes extended their post election really with the Nasdaq being the winner of the day with a gain of +1.10%. The Dow managed to again creep into record territory while the S&P added a solid +0.75%.

Energy stocks provided the fuel with oil racing ahead with a gain of +5.82% in anticipation of the scheduled OPEC meeting the end of the month. As we’ve seen in the past, there is much hope attached to the outcome of the OPECers, but it’s far from certain as to whether their jawboning results in actual production cuts.

Helping the mood on Wall Street were improved retail sales over recent months, which suggests that maybe more spending will cast a positive light on the holidays and provide a much needed boost to the economy and the next GDP reading.

After some devastating losses over the past few days, bonds finally closed up as yields pulled back, although I think that this is just the beginning of the bursting bond bubble.

Read More

The Trump Pump Slows: Dow Inches Into Record Territory But Nasdaq Drops

Ulli Market Commentary Contact

mon-pic

[Chart courtesy of MarketWatch.com]
  1. Moving the Markets

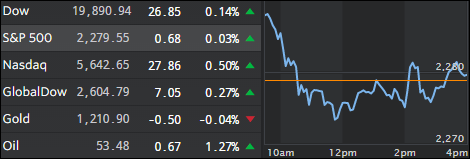
It was a tale of different markets. While the DIA made a new all-time high, the Nasdaq dropped as the rotation continued out of tech into financials, industrials, energy and transportation, all being powered by expectations that Trump’s economic policies might be beneficial for those sectors.

The dollar surged as emerging markets got crushed and bond yields surged to their highest levels in months based on increased inflation expectations. What is concerning is the speed with which the yields have been rising, which could lead to a deeper fallout in the interest rate markets and subsequently affect equities negatively.

While this rise in yields has come from very depressed levels, improved domestic growth can only be achieved with a corresponding widening of the deficit and higher inflation causing investors to demand even higher yields (lower bond prices) due to the erosion of real returns, which could then turn into a never ending vicious cycle.

Read More

One Man’s Opinion: The Jig Is Up: America’s Voters Just Fired Their Ruling Elites

Ulli Market Review Contact

OneMan'sOpinionBy David Stockman

America’s voters fired their ruling elites last night. After 30 years of arrogant misrule and wantonly planting the seeds of economic and financial ruin throughout Flyover America, the Wall Street/Washington establishment and its mainstream media tools have been repudiated like never before in modern history.

During the course of the past year, upwards of 70 million citizens—–59 million for Trump and 13 million for Bernie Sanders—-have voted for dramatic change. That is, for an end to pointless and failed wars and interventions abroad and a bubble-based economic policy at home. The latter showered Wall Street and the bicoastal elites with vast financial windfalls—-even as it left 90% of Flyover America behind, where households struggled with stagnant wages, vanishing jobs, soaring health costs, shrinking living standards and diminishing hope for the future.

The voters also said in no uncertain terms that they are fed-up with a “rigged” system that has one set of rules for establishment insiders and another for everyone else. In essence, that’s what servergate, the Clinton Foundation pay-to-play scandals and the trove of Wikileaks DNC/Podesta hacks was all about.

Read More

ETFs On The Cutline – Updated Through 11/11/2016

Ulli ETFs on the Cutline Contact

Below please find the latest High Volume ETFs Cutline report, which shows how far above or below their respective long-term trend lines (39 week SMA) my currently tracked ETFs are positioned.

This report covers the HV ETF Master List from Thursday’s StatSheet and includes 366 High Volume ETFs ETFs, defined as those with an average daily volume of more than $5 million, of which currently 181 (last week 151) are hovering in bullish territory. The yellow line separates those ETFs that are positioned above their trend line from those that have dropped below it.

Take a look:

The HV ETF Master Cutline Report            

In case you are not familiar with some of the terminology used in the reports, please read the Glossary of Terms.

If you missed the original post about the Cutline approach, you can read it here.