One Man’s Opinon: Where Will The Money Go When All Three Market Bubbles Pop?

Ulli Market Review Contact

OneMan'sOpinionBy Charles Hugh-Smith

Since the stock, bond and real estate markets are all correlated, it’s a question with no easy answer.

Everyone who’s not paid to be in denial knows stocks, bonds and real estate are in bubbles of one sort or another. Real estate is either an echo bubble or a bubble that exceeds the previous bubble, depending on how attractive the market is to hot-money investors.

pic1

Here’s a look at the inflation-adjusted S&P 500 (SPX) and margin debt: yep, a bubble.

Read More

ETFs On The Cutline – Updated Through 11/4/2016

Ulli ETFs on the Cutline Contact

Below please find the latest High Volume ETFs Cutline report, which shows how far above or below their respective long-term trend lines (39 week SMA) my currently tracked ETFs are positioned.

This report covers the HV ETF Master List from Thursday’s StatSheet and includes 366 High Volume ETFs ETFs, defined as those with an average daily volume of more than $5 million, of which currently 151 (last week 232) are hovering in bullish territory. The yellow line separates those ETFs that are positioned above their trend line from those that have dropped below it.

Take a look:

The HV ETF Master Cutline Report            

In case you are not familiar with some of the terminology used in the reports, please read the Glossary of Terms.

If you missed the original post about the Cutline approach, you can read it here.

ETF Tracker Newsletter For November 4, 2016

Ulli ETF Tracker Contact

ETF Tracker StatSheet

————————————————————-

https://theetfbully.com/2016/11/weekly-statsheet-for-the-etf-tracker-newsletter-updated-through-11032016/

————————————————————

Market Commentary

Major Indexes Post 9-Day Losing Streak; Domestic TTI Remains A Tad Below The Line

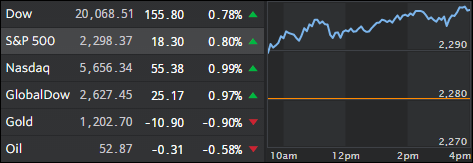
fri-pic

[Chart courtesy of MarketWatch.com]
  1. Moving the Markets

The markets meandered above the unchanged line for most of the day, giving the illusion of a rebound, but weakness set in towards the end of the session, and the indexes closed lower for the 9th day in a row. That is a dubious streak that has not happened since late 1980.

On the opposite end, the volatility index (VIX) closed higher for the 9th day in a row, which is an all-time record and means that Wall Street traders are hedging their long positions to protect against a downside surprise.

October payrolls missed and rose by 161k vs. 173k expected; however, September’s print of 156k was revised upward to 191k while the August numbers were also changed from 167k to 176k, an overall gain of 44k more than originally reported.

Still, the main focus was on the upcoming elections and the continued barrage of embarrassing emails being released by Wiki-Leaks. There is more to come this weekend and if reports are correct, the mother of all emails is still forthcoming.

Our Trend Tracking Indexes (TTIs) slipped again with the Domestic one just barely having gone negative. See section 3 below for details.

Read More

Weekly StatSheet For The ETF Tracker Newsletter – Updated Through 11/03/2016

Ulli ETF StatSheet Contact

ETF Data updated through Thursday, November 3, 2016

TOC082516

Methodology/Use of this StatSheet:

  1. From the universe of over 1,800 ETFs, I have selected only those with a trading volume of over $5 million per day (HV ETFs), so that liquidity and a small bid/ask spread are assured.
  2. Trend Tracking Indexes (TTIs)

Buy or Sell decisions for Domestic and International ETFs (section 1 and 2), are made based on the respective TTI and its position either above or below its long-term M/A (Moving Average). A crossing of the trend line from below accompanied by some staying power above constitutes a “Buy” signal. Conversely, a clear break below the line constitutes a “Sell” signal. Additionally, I use a 7.5% trailing stop loss on all positions in these categories to control downside risk.

  1. All other investment arenas do not have a TTI and should be traded based on the position of the individual ETF relative to its own respective trend line (%M/A). That’s why those signals are referred to as a “Selective Buy.” In other words, if an ETF crosses its own trend line to the upside, a “Buy” signal is generated. Since these areas tend to be more volatile, I recommend a wider trailing sell stop of 7.5% -10% depending on your risk tolerance.

If you are unfamiliar with some of the terminology, please see Glossary of Terms and new subscriber information in section 9.


  1. DOMESTIC EQUITY ETFs: BUY — since 4/4/2016

tti

Our main directional indicator, the Domestic Trend Tracking Index (TTI-green line in the above chart) just slipped below its long-term trend line (red) by a scant -0.01% after having generated a new Domestic Buy signal effective 4/4/2016 as posted. I’d like to more downside momentum before issuing a “Sell” signal as referred to in today’s commentary (section 3).

Read More

S&P Losing Streak Extends To 8 Days; Domestic TTI Slips A Tad Below Its Trend Line

Ulli Market Commentary Contact

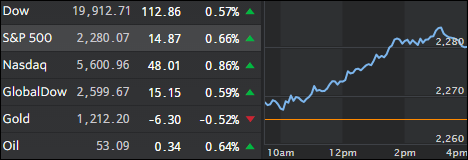
thur-pic

[Chart courtesy of MarketWatch.com]
  1. Moving the Markets

The market environment is getting shaky with the S&P now down 8 days in a row, which is the longest losing streak since Lehman collapsed in 2008. So, it’s no surprise that the volatility index (VIX) shared this dubious record by having rallied for 8 straight days, which is only the 3rd time in history this has happened with the other dates being April 2012 and December 2013. (Hat tip to ZH for this data).

As I said yesterday, the pullback has been orderly and lacked magnitude, but odds seem to be increasing that downside momentum could accelerate with a vengeance, especially if an outsider like Trump were to win the elections next week.

Not helping the indexes today were several disappointing earnings and economic reports. Factory orders and initial jobless claims came in less than expected making tomorrow’s payroll report the center of attention in the hope that it could spark a rebound rally. It was interesting to note that today’s bad news was in fact bad news as the major indexes headed lower and not higher as they have been for most of this year. Is this a sign of things to come?

Read More

Fed Can’t Save The Market From Sliding; Domestic TTI Inches Towards “Sell” Signal

Ulli Market Commentary Contact

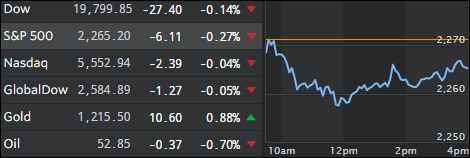
wed-pic

[Chart courtesy of MarketWatch.com]
  1. Moving the Markets

Even the Fed with their announcement of leaving interest rates unchanged could not prevent the major indexes from slipping for the 7th day in a row, which represents their longest losing streak in 5 years. However, when looking at the actual numbers it translates to a loss of only -2.5% for the S&P 500; hardly an earthshaking number.

Supporting this weakness was the fact that the Fed signaled that a December hike was in the cards and that they allegedly don’t need any more evidence before moving, that is if you translate their subtle announcement correctly.

What is more critical is the fact that this 7-day slippage was enough to propel our Domestic Trend Tracking Index (TTI) to the cusp of a new “Sell” signal, as you can see in section 3 below.

At this point in time, it’s always interesting to see if there are other indicators that are confirming a potential move into bear market territory. ZeroHedge featured 2 charts, which are indicative of the environment we are currently in. Take a look:

Read More