Priced To Perfection

Ulli Market Commentary Contact

tue-pic

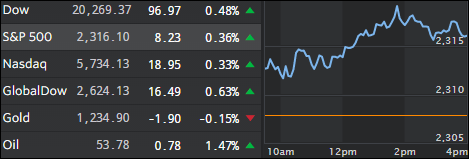
[Chart courtesy of MarketWatch.com]
  1. Moving the Markets

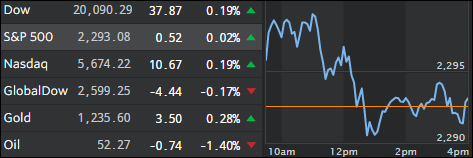
The post-election levitation continued as the major indexes edged higher with the S&P 500 and the Dow taking out new milestone markers for the first time; i.e. the 2,200 and 19,000 levels, although with low volume during this Holiday shortened week.

Again, Wall Street’s focus remains on the Trump promises of less regulations, tax cuts and the mother of all infrastructure spending, which would benefit a  wide variety of industries. Especially tax cuts are in focus as they are assumed to boost earnings per share and increase the odds of a longer lasting economic expansion.

However, at this point it’s nothing but “irrational exuberance,” to use former Fed chief Greenspan’s famous words. So far, this rally is based on nothing but hope and should President-elect Trump fail to execute, or bond yields continue to spike more than expected, there will likely be a price to be paid in form of a sharp correction.

A big focus in the media has been the fact that all major indexes have closed at record highs on the same day. Well, as ZH pointed out, the last time this happened it did not work out so well, as the following chart clearly shows:

Read More

Major Indexes Jump To Record Highs

Ulli Market Commentary Contact

mon-pic

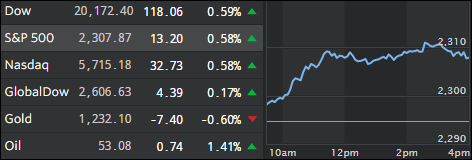
[Chart courtesy of MarketWatch.com]
  1. Moving the Markets

The Trump pump continued with full force as all 3 major indexes set record closing highs today supported by energy and commodity shares. Oil prices jumped and managed to gain almost 4%.

There were no actual news events driving this rally other than investors jumping on the Trump theme of massive infrastructure projects while trying to figure out which sectors might benefit the most. Optimism prevails that Trump will ease regulations and reduce taxes providing further hope that equities are the place to be with both consumers and corporations benefiting.

Additionally, with bonds having been spanked as rates rose over the past week, the flow of funds has been out of bonds and into equities with data showing that $45.7 billion were moved into equity ETFs in the past eight trading days ending Thursday, the biggest inflow on record.

Color me skeptical but this euphoria assumes that Trump will not only actually implement these campaign promises but the market is betting on ideas that haven’t even been introduced to Congress yet. Then there is the notion that we can simply continue piling new debt on top of old debt in the face of a rising interest environment. New data shows that a minor ¼% increase in rates translates to an increase in annual debt payments of $50 billion. But that’s the future; for right now let’s enjoy the rally for as along as it may last.

Read More

One Man’s Opinion: What Happens When 2-Term Presidencies End?

Ulli Market Review Contact

OneMan'sOpinion

By ZeroHedge

Four words – nothing good for stocks.

preseindential-terms

With the election decided, the burning question now is, “What next?” And, as Axioma details in their latest report, as “unprecedented” as the 2016 US Presidential election may have been, there are at least some precedents to which we can point for insights into what may now lie ahead.

Read More

ETFs On The Cutline – Updated Through 11/18/2016

Ulli ETFs on the Cutline Contact

Below please find the latest High Volume ETFs Cutline report, which shows how far above or below their respective long-term trend lines (39 week SMA) my currently tracked ETFs are positioned.

This report covers the HV ETF Master List from Thursday’s StatSheet and includes 365 High Volume ETFs ETFs, defined as those with an average daily volume of more than $5 million, of which currently 183 (last week 181) are hovering in bullish territory. The yellow line separates those ETFs that are positioned above their trend line from those that have dropped below it.

Take a look:

The HV ETF Master Cutline Report            

In case you are not familiar with some of the terminology used in the reports, please read the Glossary of Terms.

If you missed the original post about the Cutline approach, you can read it here.

ETF Tracker Newsletter For November 18, 2016

Ulli ETF Tracker Contact

ETF Tracker StatSheet

————————————————————-

https://theetfbully.com/2016/11/weekly-statsheet-for-the-etf-tracker-newsletter-updated-through-11172016/

————————————————————

Market Commentary

MAJOR INDEXES PULL BACK HEADING INTO THE WEEKEND

fri-pic

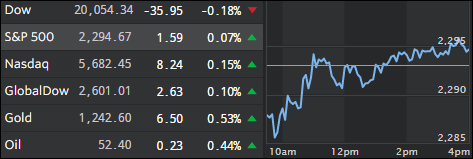
[Chart courtesy of MarketWatch.com]
  1. Moving the Markets

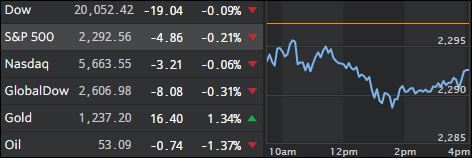
The post election bull market slowed down today, and the major indexes finished with slight losses. The dollar was on a tear again and extended its rally in part supported by Fed chief Yellen’s comments that boosted expectations (now at 83%) for a December rate hike.

Financials gained slightly and were followed by energy stocks, which were supported by an uptick in oil prices; oil vacillated in a wide range above and below its unchanged line but managed to eke out a +0.31% gain.

Interest rates continued their upward trend with the 10-year Treasury now yielding some 2.35%. Gold lost again but managed to bounce off its $1,200 level; at least for the time being. Healthcare led to the downside as uncertainty about the new administration’s policies need more clarification.

After the decent post election move, things seemed to slow down a bit as the rally lost some steam; nevertheless, the major indexes closed higher for the second week in a row. Whether this bullish theme can continue or not depends if Trump’s policies are simply rhetoric or if he can actually pass proposals to implement infrastructure spending along with the widely expected reduction in taxes.

Read More

Weekly StatSheet For The ETF Tracker Newsletter – Updated Through 11/17/2016

Ulli ETF StatSheet Contact

ETF Data updated through Thursday, November 17, 2016

TOC082516

Methodology/Use of this StatSheet:

  1. From the universe of over 1,800 ETFs, I have selected only those with a trading volume of over $5 million per day (HV ETFs), so that liquidity and a small bid/ask spread are assured.
  2. Trend Tracking Indexes (TTIs)

Buy or Sell decisions for Domestic and International ETFs (section 1 and 2), are made based on the respective TTI and its position either above or below its long-term M/A (Moving Average). A crossing of the trend line from below accompanied by some staying power above constitutes a “Buy” signal. Conversely, a clear break below the line constitutes a “Sell” signal. Additionally, I use a 7.5% trailing stop loss on all positions in these categories to control downside risk.

  1. All other investment arenas do not have a TTI and should be traded based on the position of the individual ETF relative to its own respective trend line (%M/A). That’s why those signals are referred to as a “Selective Buy.” In other words, if an ETF crosses its own trendline to the upside, a “Buy” signal is generated. Since these areas tend to be more volatile, I recommend a wider trailing sell stop of 7.5% -10% depending on your risk tolerance.

If you are unfamiliar with some of the terminology, please see Glossary of Terms and new subscriber information in section 9.


  1. DOMESTIC EQUITY ETFs: BUY — since 4/4/2016

tti

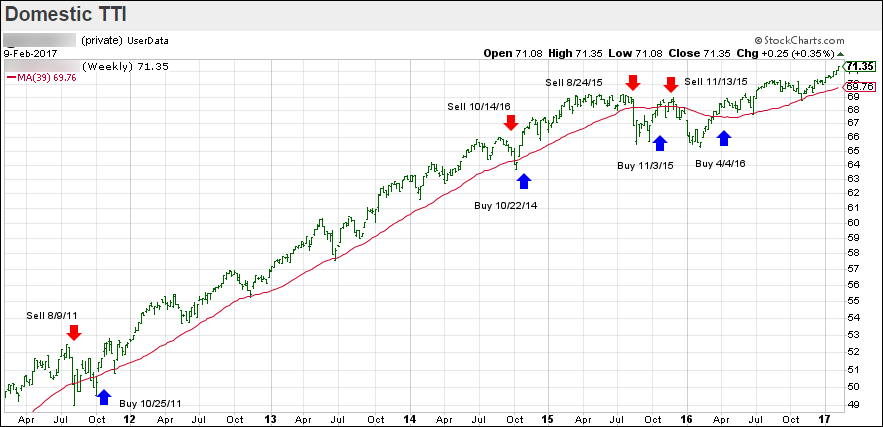
Our main directional indicator, the Domestic Trend Tracking Index (TTI-green line in the above chart) is positioned above its long-term trend line (red) by +1.09% after having generated a new Domestic Buy signal effective 4/4/2016 as posted.

Read More