
- Moving the Markets
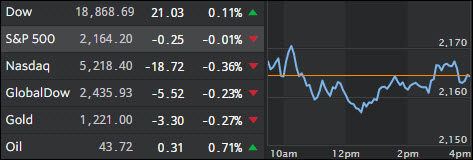
It was a tale of different markets. While the DIA made a new all-time high, the Nasdaq dropped as the rotation continued out of tech into financials, industrials, energy and transportation, all being powered by expectations that Trump’s economic policies might be beneficial for those sectors.
The dollar surged as emerging markets got crushed and bond yields surged to their highest levels in months based on increased inflation expectations. What is concerning is the speed with which the yields have been rising, which could lead to a deeper fallout in the interest rate markets and subsequently affect equities negatively.
While this rise in yields has come from very depressed levels, improved domestic growth can only be achieved with a corresponding widening of the deficit and higher inflation causing investors to demand even higher yields (lower bond prices) due to the erosion of real returns, which could then turn into a never ending vicious cycle.
- ETFs in the Spotlight
In case you missed the announcement and description of this section, you can read it here again.
It features 10 broadly diversified ETFs from my HighVolume list as posted every Monday. Furthermore, they are screened for the lowest MaxDD% number meaning they have been showing better resistance to temporary sell offs than all others over the past year.
Here are the 10 candidates:
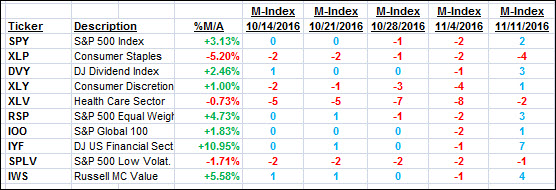
The above table simply demonstrates the magnitude with which some of the ETFs are fluctuating in regards to their positions above or below their respective individual trend lines (%M/A). A break below, represented by a negative number, shows weakness, while a break above, represented by a positive percentage, shows strength.
For hundreds of ETF choices, be sure to reference Thursday’s StatSheet.
Year to date, here’s how the above candidates have fared so far:
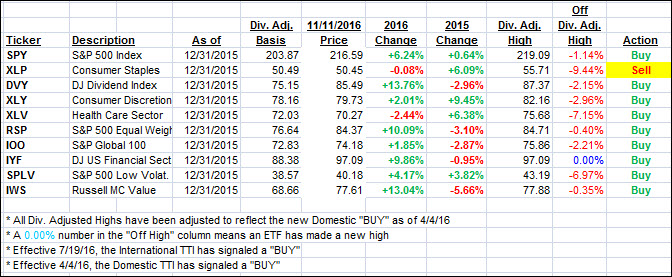
Again, the first table above shows the position of the various ETFs in relation to their respective long term trend lines (%M/A), while the second one tracks their trailing sell stops in the “Off High” column. The “Action” column will signal a “Sell” once the -7.5% point has been taken out in the “Off High” column.
- Trend Tracking Indexes (TTIs)
Our Trend Tracking Indexes (TTIs) slipped as the major indexes vacillated above and below their respective trend lines with the S&P ending up essentially unchanged.
Here’s how we closed 11/14/2016:
Domestic TTI: +0.57% (last close +0.73%)—Buy signal effective 4/4/2016
International TTI: +2.01% (last close +2.14%)—Buy signal effective 7/19/2016
Disclosure: I am obliged to inform you that I, as well as my advisory clients, own some of the ETFs listed in the above table. Furthermore, they do not represent a specific investment recommendation for you, they merely show which ETFs from the universe I track are falling within the guidelines specified.
Contact Ulli