A Mixed Bag

Ulli Market Commentary Contact

tue-pic

[Chart courtesy of MarketWatch.com]
  1. Moving the Markets

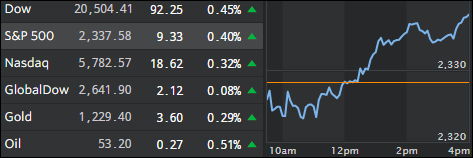
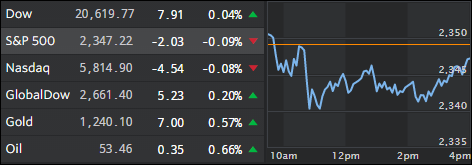
News-wise, it was a mixed bag as health insurers offered an upbeat outlook while a sharp drop in oil prices (-3.87%) pulled down energy shares. The major indexes got off to a good start, faded in the end but managed to close above the unchanged line by a small margin.

The steam of the Trump rally appears to have slowed down some, which makes sense, as none of what ails this country has been resolved. The focus has simply been shifted to the possible economic expectations associated with a Trump presidency, and it remains to be seen if those good intentions can actually be turned into reality.

Hope vs. reality, the theme of the stock market over the past year, during which hope has been the clear winner, but what about next year? How do 2017 GDP growth expectations line up with the current level of the major indexes? ZH presented the following chart:

Read More

Trump Pump Hits A Speed Bump

Ulli Market Commentary Contact

mon-pic

[Chart courtesy of MarketWatch.com]
  1. Moving the Markets

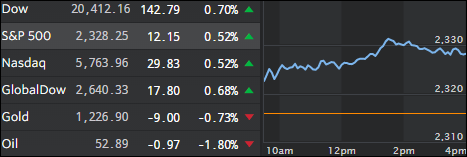
The smooth three week post-election ride of the major indexes hit a speed bump today with equities notching their worst performance in almost a month. However, that’s sounds worse than it actually was as the S&P 500 and the Nasdaq gave back only around 0.5%, which is hardly earth shaking.

The main culprits for the pullback were the consumer discretionary and financial sectors, which have been among the best performers since the election; gold bucked the trend and gained the most in a month (+1.30%). The US dollar, which had been on a tear ever since bond yields spiked, had its biggest drop in a month.

Oil rallied and ended higher but not before giving back half of its gains after the OPEC session ended as usual in no certifiable agreement. This stock market rally may not be all it’s cracked up to be as volume was notably absent as ZH reports. The chart below clearly shows that equity trading volume collapsed while bond trading volume exploded to five year highs:

Read More

One Man’s Opinion: A Recession Could Change Everything

Ulli Market Review Contact

OneMan'sOpinionBy John Mauldin

How on God’s green earth are we supposed to make sense, from an economic and investment portfolio view, of what is happening?

A recession could change everything

It has been quite a while since we have had a recession. When we do have one, it’s going to further limit our choices.

Donald Trump

The economic realities of the world have not shifted much in one week. We still have too much debt, not just in the US but around the world. Budget deficits are out of control, not just in the US but around the world.

The reactionary forces of protectionism are loose, and the results might not be salutary for investors. Markets are stretched to valuations that have historically been dangerous.

Read More

ETFs On The Cutline – Updated Through 11/25/2016

Ulli ETFs on the Cutline Contact

Below please find the latest High Volume ETFs Cutline report, which shows how far above or below their respective long-term trend lines (39 week SMA) my currently tracked ETFs are positioned.

This report covers the HV ETF Master List from Thursday’s StatSheet and includes 365 High Volume ETFs ETFs, defined as those with an average daily volume of more than $5 million, of which currently 200 (last week 183) are hovering in bullish territory. The yellow line separates those ETFs that are positioned above their trend line from those that have dropped below it.

Take a look:

The HV ETF Master Cutline Report            

In case you are not familiar with some of the terminology used in the reports, please read the Glossary of Terms.

If you missed the original post about the Cutline approach, you can read it here.

ETF Tracker Newsletter For November 25, 2016

Ulli Market Commentary Contact

ETF Tracker StatSheet

https://theetfbully.com/?p=18121&preview=true

Market Commentary

Major Indexes Inch Higher During Holiday Shortened Week

fri-pic

[Chart courtesy of MarketWatch.com]
  1. Moving the Markets

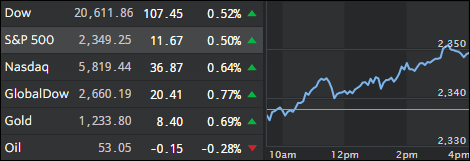
There was no letting up this week as the major indexes kept the rally going with the only fly in the ointment being extremely low volume as many traders took off for the Thanksgiving holiday. The S&P 500 managed to gain +1.4% during the past four trading days.

Investors were keeping an eye on retailers during this Black Friday, but initial reviews saw store traffic as being subdued across the nation, most likely due to early discounted selling over the past few weeks. Another argument could be that consumers are suffering from sticker shock caused by soaring Obama-care premiums reducing disposable cash for the holidays. Dollar sales in the second week of November were 8 percent lower than in the same period last year.

Ten of the eleven major S&P sectors closed higher with the leader being utilities, which sported a gain of +1.43%. The energy sector closed down propelled by a loss of -4.17% in oil prices, which “enjoyed” their headline driven roller coaster ride. Bond prices slipped as yields rose, a phenomenon that, depending on its continued magnitude, will affect the stock market negatively at some point in the future.

Read More

Weekly StatSheet For The ETF Tracker Newsletter – Updated Through 11/23/2016

Ulli ETF StatSheet Contact

ETF Data updated through Wednesday, November 23, 2016

TOC082516

Methodology/Use of this StatSheet:

  1. From the universe of over 1,800 ETFs, I have selected only those with a trading volume of over $5 million per day (HV ETFs), so that liquidity and a small bid/ask spread are assured.
  2. Trend Tracking Indexes (TTIs)

Buy or Sell decisions for Domestic and International ETFs (section 1 and 2), are made based on the respective TTI and its position either above or below its long-term M/A (Moving Average). A crossing of the trend line from below accompanied by some staying power above constitutes a “Buy” signal. Conversely, a clear break below the line constitutes a “Sell” signal. Additionally, I use a 7.5% trailing stop loss on all positions in these categories to control downside risk.

  1. All other investment arenas do not have a TTI and should be traded based on the position of the individual ETF relative to its own respective trend line (%M/A). That’s why those signals are referred to as a “Selective Buy.” In other words, if an ETF crosses its own trendline to the upside, a “Buy” signal is generated. Since these areas tend to be more volatile, I recommend a wider trailing sell stop of 7.5% -10% depending on your risk tolerance.

If you are unfamiliar with some of the terminology, please see Glossary of Terms and new subscriber information in section 9.


  1. DOMESTIC EQUITY ETFs: BUY — since 4/4/2016

tti

Our main directional indicator, the Domestic Trend Tracking Index (TTI-green line in the above chart) is positioned above its long-term trend line (red) by +1.07% after having generated a new Domestic Buy signal effective 4/4/2016 as posted.

Read More