One Man’s Opinion: Ron Paul Tells Trump: “To Really ‘Make America Great Again’, End The Fed!”

Ulli Market Review Contact

OneMan'sOpinionBy ZeroHedge

Former Dallas Federal Reserve Bank President Richard Fisher recently gave a speech identifying the Federal Reserve’s easy money/low interest rate policies as a source of the public anger that propelled Donald Trump into the White House. Mr. Fisher is certainly correct that the Fed’s policies have “skewered” the middle class. However, the problem is not specific Fed policies, but the very system of fiat currency managed by a secretive central bank.

Federal Reserve-generated increases in money supply cause economic inequality. This is because, when the Fed acts to increase the money supply, well-to-do investors and other crony capitalists are the first recipients of the new money. These economic elites enjoy an increase in purchasing power before the Fed’s inflationary policies lead to mass price increases. This gives them a boost in their standard of living.

By the time the increased money supply trickles down to middle- and working-class Americans, the economy is already beset by inflation. So most average Americans see their standard of living decline as a result of Fed-engendered money supply increases.

Read More

ETFs On The Cutline – Updated Through 12/2/2016

Ulli ETFs on the Cutline Contact

Below please find the latest High Volume ETFs Cutline report, which shows how far above or below their respective long-term trend lines (39 week SMA) my currently tracked ETFs are positioned.

This report covers the HV ETF Master List from Thursday’s StatSheet and includes 365 High Volume ETFs ETFs, defined as those with an average daily volume of more than $5 million, of which currently 191 (last week 200) are hovering in bullish territory. The yellow line separates those ETFs that are positioned above their trend line from those that have dropped below it.

Take a look:

The HV ETF Master Cutline Report            

In case you are not familiar with some of the terminology used in the reports, please read the Glossary of Terms.

If you missed the original post about the Cutline approach, you can read it here.

ETF Tracker Newsletter For December 2, 2016

Ulli Market Commentary Contact

ETF Tracker StatSheet

https://theetfbully.com/2016/12/weekly-statsheet-for-the-etf-tracker-newsletter-updated-through-12012016/

Market Commentary

Trump Euphoria Fades

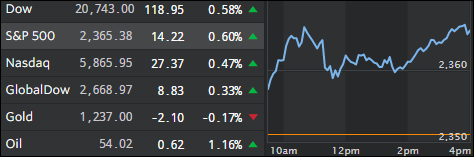
fri-pic

[Chart courtesy of MarketWatch.com]
  1. Moving the Markets

On the surface, today’s payroll data was a resounding success with the US jobless rate falling to 9-year lows and employers adding some 178,000 jobs confirming that the 100% rate hike odds when the Fed meets later on this month may turn into reality.

Of course, as always, the devil about this “shining” jobs report is in the details as Americans no longer in the labor force soared to 95 million with a spike of 446,000 coming in November. The more troubling fact was that over the past three months did full-time jobs not only decline by 99,000, part-time jobs rose by an amazing 638,000 confirming that the quality of employment is not what it’s cracked up to be.

On the week, the markets suffered from a lack of enthusiasm as Trump euphoria waned and stocks bobbed and weaved, with ZH summing it up as follows:

  • Nasdaq’s worst week since Feb 2016
  • Small Caps worst week since Feb 2016
  • Bank stocks up 4 weeks in a row to highest since Jan 2008
  • FANG Stocks down 4 of the last 6 weeks
  • Treasuries down 4 weeks in a row, TLT lowest close in a year
  • USD Index down first time in 4 weeks
  • Oil’s best week since Feb 2011 (at highest since July 2015)
  • Gold down 4 weeks in a row to 10 month lows


This weekend, all eyes will be on Italy, which will cause some worry for the European markets as Sunday’s referendum has traders on edge. If the vote goes against the government, and there is a good chance of that, the PM will resign and will be replaced by an anti-euro party that could throw the Italian banks into crisis mode and the European markets into upheaval. Stay tuned!

Read More

Weekly StatSheet For The ETF Tracker Newsletter – Updated Through 12/01/2016

Ulli ETF StatSheet Contact

ETF Data updated through Wednesday, December 1, 2016

TOC082516

Methodology/Use of this StatSheet:

  1. From the universe of over 1,800 ETFs, I have selected only those with a trading volume of over $5 million per day (HV ETFs), so that liquidity and a small bid/ask spread are assured.
  2. Trend Tracking Indexes (TTIs)

Buy or Sell decisions for Domestic and International ETFs (section 1 and 2), are made based on the respective TTI and its position either above or below its long-term M/A (Moving Average). A crossing of the trend line from below accompanied by some staying power above constitutes a “Buy” signal. Conversely, a clear break below the line constitutes a “Sell” signal. Additionally, I use a 7.5% trailing stop loss on all positions in these categories to control downside risk.

  1. All other investment arenas do not have a TTI and should be traded based on the position of the individual ETF relative to its own respective trend line (%M/A). That’s why those signals are referred to as a “Selective Buy.” In other words, if an ETF crosses its own trendline to the upside, a “Buy” signal is generated. Since these areas tend to be more volatile, I recommend a wider trailing sell stop of 7.5% -10% depending on your risk tolerance.

If you are unfamiliar with some of the terminology, please see Glossary of Terms and new subscriber information in section 9.


  1. DOMESTIC EQUITY ETFs: BUY — since 4/4/2016

tti

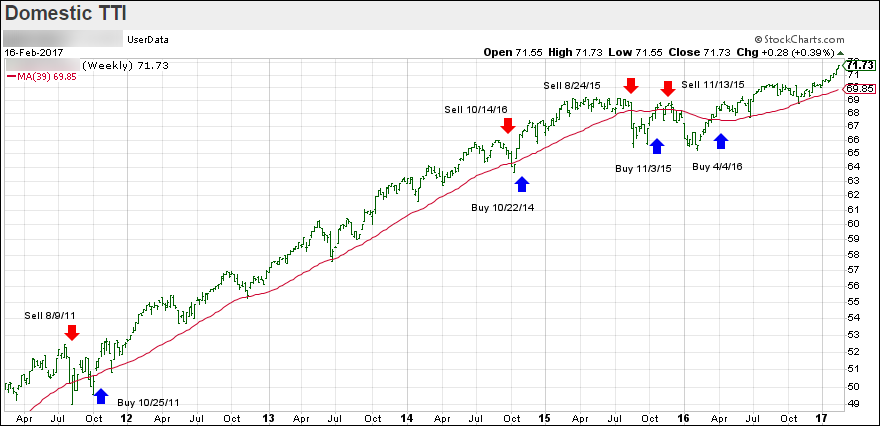
Our main directional indicator, the Domestic Trend Tracking Index (TTI-green line in the above chart) is positioned above its long-term trend line (red) by +0.36% after having generated a new Domestic Buy signal effective 4/4/2016 as posted.

Read More

A Tale Of Two Markets

Ulli Market Commentary Contact

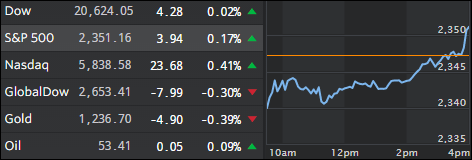
thur-pic

[Chart courtesy of MarketWatch.com]
  1. Moving the Markets

It was a tale of two markets with the Dow still pushing into record territory while the Nasdaq tanked and closed below the unchanged line joined by the S&P 500. The Dow’s support came from the banking and energy sector, the latter which was powered by continued strength in oil prices (+2.97%) as the recent OPEC agreement apparently has not been reneged on—yet.

In economic headlines, the initial jobless claims took front and center. In the two weeks since the election they have soared over 35,000 (or 15%) to five month highs, the biggest two week rise since December 2014. As the ZH succinctly noted, “this is entirely against the exuberant narrative being spun by the US equity markets.”

On the interest rate front, the bloodbath continued with yields soaring worldwide as the 10-year US bond gained some 6 basis points to close at 2.45%. There will a moment in time when that relentless increase in yields will severely affect US stocks. As I mentioned yesterday in the Trend Tracking section:

It’s important to note that our Domestic TTI has not rallied in its usual fashion, a sign that rising bond yields have generated some headwind, which will play a much bigger (negative) role in regards to equity prices should yields continue to ratchet higher.

I think we are getting closer as our Domestic TTI has now moved within striking distance of a potential “Sell” signal with that oddity occurring in the face of the Dow making new lifetime highs. See section 3 below for today’s closing numbers.

Read More

A Weak Finish After A Solid Month

Ulli Market Commentary Contact

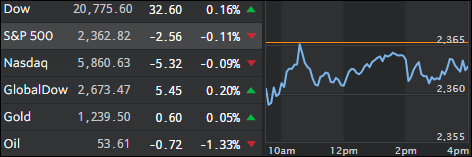
wed-pic

[Chart courtesy of MarketWatch.com]
  1. Moving the Markets

Thanks to the Trump post-election rally, the month of November ended up being a positive one, an amazing feat when considering that on election night the futures were way down with the Dow at point being in the negative by almost 900 points.

Today, all the glory went to the energy complex (+4.8%) propelled by oil prices which rocketed higher by over 8% and within striking distance of the $50/bbl milestone. The cause of this rally was an alleged OPEC agreement curtailing production. Sure, we’ve seen this movie many times before, so it remains to be seen if this is a deal that is truly nailed down. I have my doubts.

While November was quite a month for the indexes, it’s interesting to note, that widely diversified portfolios with international exposure were left in the dust as the Trump rally was concentrated primarily in domestic equities. ZH posted this spot-on chart:

Read More