
- Moving the Markets
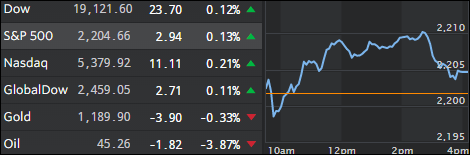
News-wise, it was a mixed bag as health insurers offered an upbeat outlook while a sharp drop in oil prices (-3.87%) pulled down energy shares. The major indexes got off to a good start, faded in the end but managed to close above the unchanged line by a small margin.
The steam of the Trump rally appears to have slowed down some, which makes sense, as none of what ails this country has been resolved. The focus has simply been shifted to the possible economic expectations associated with a Trump presidency, and it remains to be seen if those good intentions can actually be turned into reality.
Hope vs. reality, the theme of the stock market over the past year, during which hope has been the clear winner, but what about next year? How do 2017 GDP growth expectations line up with the current level of the major indexes? ZH presented the following chart:
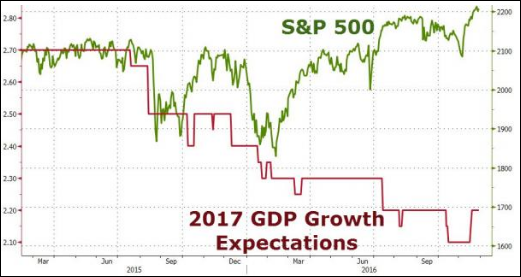
It looks eerily similar to the 2016 GDP chart as the gap between hope and reality remains as wide as ever. Can this end well?
- ETFs in the Spotlight
In case you missed the announcement and description of this section, you can read it here again.
It features 10 broadly diversified ETFs from my HighVolume list as posted every Monday. Furthermore, they are screened for the lowest MaxDD% number meaning they have been showing better resistance to temporary sell offs than all others over the past year.
Here are the 10 candidates:
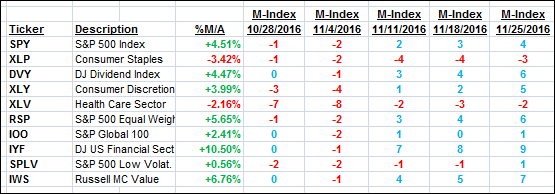
The above table simply demonstrates the magnitude with which some of the ETFs are fluctuating in regards to their positions above or below their respective individual trend lines (%M/A). A break below, represented by a negative number, shows weakness, while a break above, represented by a positive percentage, shows strength.
For hundreds of ETF choices, be sure to reference Thursday’s StatSheet.
Year to date, here’s how the above candidates have fared so far:
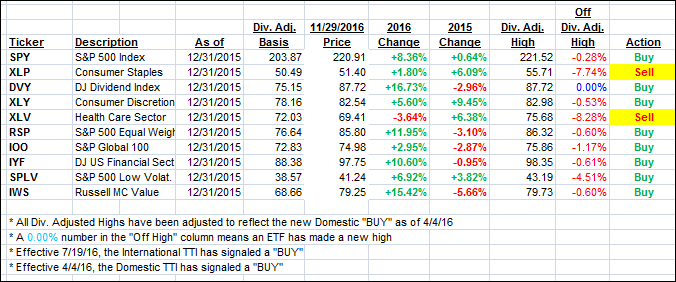
Again, the first table above shows the position of the various ETFs in relation to their respective long term trend lines (%M/A), while the second one tracks their trailing sell stops in the “Off High” column. The “Action” column will signal a “Sell” once the -7.5% point has been taken out in the “Off High” column.
- Trend Tracking Indexes (TTIs)
Our Trend Tracking Indexes (TTIs) managed to head north as the major indexes edged out a small gain.
Here’s how we closed 11/29/2016:
Domestic TTI: +1.00% (last close +0.91%)—Buy signal effective 4/4/2016
International TTI: +1.85% (last close +1.57%)—Buy signal effective 7/19/2016
Disclosure: I am obliged to inform you that I, as well as my advisory clients, own some of the ETFs listed in the above table. Furthermore, they do not represent a specific investment recommendation for you, they merely show which ETFs from the universe I track are falling within the guidelines specified.
Contact Ulli