
ETF Tracker StatSheet
https://theetfbully.com/?p=18121&preview=true
Market Commentary
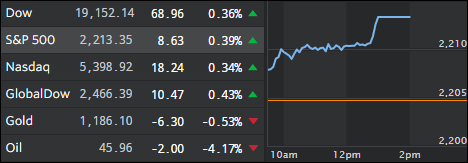
Major Indexes Inch Higher During Holiday Shortened Week
- Moving the Markets
There was no letting up this week as the major indexes kept the rally going with the only fly in the ointment being extremely low volume as many traders took off for the Thanksgiving holiday. The S&P 500 managed to gain +1.4% during the past four trading days.
Investors were keeping an eye on retailers during this Black Friday, but initial reviews saw store traffic as being subdued across the nation, most likely due to early discounted selling over the past few weeks. Another argument could be that consumers are suffering from sticker shock caused by soaring Obama-care premiums reducing disposable cash for the holidays. Dollar sales in the second week of November were 8 percent lower than in the same period last year.
Ten of the eleven major S&P sectors closed higher with the leader being utilities, which sported a gain of +1.43%. The energy sector closed down propelled by a loss of -4.17% in oil prices, which “enjoyed” their headline driven roller coaster ride. Bond prices slipped as yields rose, a phenomenon that, depending on its continued magnitude, will affect the stock market negatively at some point in the future.
- ETFs in the Spotlight
In case you missed the announcement and description of this section, you can read it here again.
It features 10 broadly diversified ETFs from my HighVolume list as posted every Monday. Furthermore, they are screened for the lowest MaxDD% number meaning they have been showing better resistance to temporary sell offs than all others over the past year.
Here are the 10 candidates:
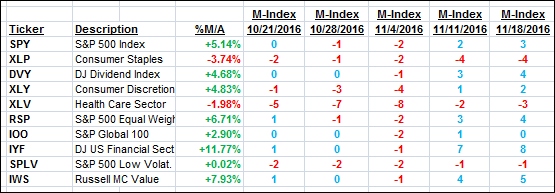
The above table simply demonstrates the magnitude with which some of the ETFs are fluctuating in regards to their positions above or below their respective individual trend lines (%M/A). A break below, represented by a negative number, shows weakness, while a break above, represented by a positive percentage, shows strength.
For hundreds of ETF choices, be sure to reference Thursday’s StatSheet.
Year to date, here’s how the above candidates have fared so far:
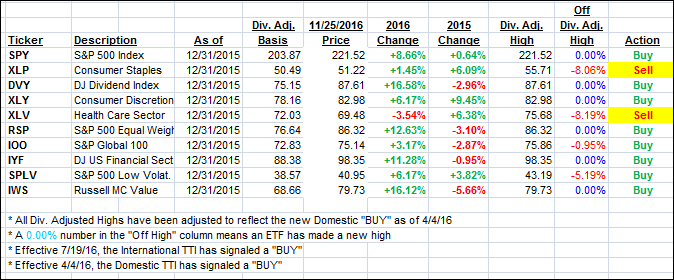
Again, the first table above shows the position of the various ETFs in relation to their respective long term trend lines (%M/A), while the second one tracks their trailing sell stops in the “Off High” column. The “Action” column will signal a “Sell” once the -7.5% point has been taken out in the “Off High” column.
- Trend Tracking Indexes (TTIs)
Our Trend Tracking Indexes (TTIs) improved as the Trump pump continued throughout this holiday shortened week.
Here’s how we closed 11/25/2016:
Domestic TTI: +1.12% (last Friday +0.78%)—Buy signal effective 4/4/2016
International TTI: +2.28% (last Friday +1.59%)—Buy signal effective 7/19/2016
Have a great weekend.
Ulli…
Disclosure: I am obliged to inform you that I, as well as my advisory clients, own some of the ETFs listed in the above table. Furthermore, they do not represent a specific investment recommendation for you, they merely show which ETFs from the universe I track are falling within the guidelines specified.
————————————————————-
READER Q & A FOR THE WEEK
All Reader Q & A’s are listed at our web site!
Check it out at:
https://theetfbully.com/questions-answers/
———————————————————-
WOULD YOU LIKE TO HAVE YOUR INVESTMENTS PROFESSIONALLY MANAGED?
Do you have the time to follow our investment plans yourself? If you are a busy professional who would like to have his portfolio managed using our methodology, please contact me directly or get more details at:
https://theetfbully.com/personal-investment-management/
———————————————————
Back issues of the ETF/No Load Fund Tracker are available on the web at:
https://theetfbully.com/newsletter-archives/
Contact Ulli