Dow Inches To 12th Record High Close

Ulli Market Commentary Contact

[Chart courtesy of MarketWatch.com]
  1. Moving the Markets

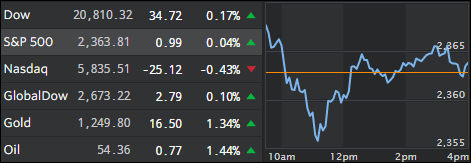
The wining streak continued despite a weak opening, but the bulls were determined not to interrupt the current march towards new record highs, and mid-day the major indexes slowly crawled above the unchanged line and eked out a tiny gain; but a gain nonetheless.

Throwing in an assist was President Trump when he upped the ante by stating that he’d make a “big” infrastructure statement on Tuesday. Additionally, he uttered those words that Wall Street wanted to hear, namely that he is seeking a “historic” increase in military spending of more than 9% while also reinforcing that his administration would be “moving quickly” on regulatory reforms.

All of this was a warm-up or a priming of the pump ahead of his first address to a joint session of Congress tomorrow night. If he provides more specifics on his plans and meets current hyped up expectations, we could see more upside in the markets. If, however, the picture remains murky with vague details combined with an uncertain time line, we could see a long overdue pullback set in confirming what is believed by some to be a “suckers” rally.

Read More

One Man’s Opinion: There Is A Cost To Fed Policy!

Ulli Market Review Contact

By ZeroHedge

The Federal Reserve has pursued the unprecedented monetary policy of lowering rates to zero and increasing their portfolio from 500 billion to over 4 trillion.  These are policies aiming to achieve maximum employment and low inflation. By many measures, they were successful. Growth of around 2% is at the long term US average and recent core inflation measures are coming in around 2%. But as the Fed reminds us, there is a cost to their policies. However, they do not lay out explicitly what those costs are, nor how expensive they can be. They just try to reassure the public by saying they are monitoring them.

I recently had conversations with novice market participants who were stunned by the size and rapid growth of a number of hedge funds and financial firms.  Some firms that recently had capital in the low billions are now in the hundreds of billions with assets in the trillions. This made these novices nervous, and rightfully so. Though most have no idea what “there are costs to Fed policy” means, these people have identified the biggest costs to Fed policy without realizing it.

Read More

ETFs On The Cutline – Updated Through 02/24/2017

Ulli ETFs on the Cutline Contact

Below please find the latest High Volume ETFs Cutline report, which shows how far above or below their respective long-term trend lines (39 week SMA) my currently tracked ETFs are positioned.

This report covers the HV ETF Master List from Thursday’s StatSheet and includes 366 High Volume ETFs ETFs, defined as those with an average daily volume of more than $5 million, of which currently 246 (last week 237) are hovering in bullish territory. The yellow line separates those ETFs that are positioned above their trend line (%M/A) from those that have dropped below it.

Take a look:

The HV ETF Master Cutline Report            

In case you are not familiar with some of the terminology used in the reports, please read the Glossary of Terms.

If you missed the original post about the Cutline approach, you can read it here.

ETF Tracker Newsletter For February 24, 2017

Ulli ETF Tracker Contact

ETF Tracker StatSheet

https://theetfbully.com/?p=18573&preview=true

Last Hour Buying Pushes Dow To 11th Record In A Row

[Chart courtesy of MarketWatch.com]
  1. Moving the Markets

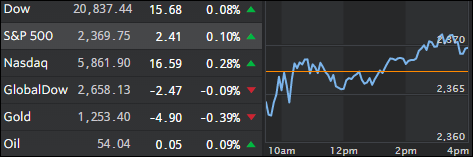
I simply had to laugh out loud when I saw the above chart right after the close. The indexes had spent all day below the unchanged line and it looked like a down day was in the making. The Dow was in danger of seeing its 10 day record streak come to an end when, with only 17 seconds left, as if by magic, sudden buying pushed the index barely into the green and to its 11th record close in a row, its longest streak in 30 years.

Of course, we all know that in this “new normal” stock market nirvana, markets are no longer allowed to close red into the weekend. Seeing this obvious manipulation, as the algos continued to play financial ping-pong, I just can’t help being facetious about it…

In the bigger picture, the Dow has now closed up 3 weeks in a row, the S&P 500 and Nasdaq had their 5th up week in a row, but Small Caps did not fare so well and saw their biggest weekly pullback in 5 weeks. Hat tip goes to ZH for some of these stats.

The tech sector suffered its biggest decline of the year, financials had their worst day in 5 weeks, and the Big Banks were all red on the week. Bonds were up for the 5th day in a row as yields dropped and precious metals were the leaders with Gold reclaiming its $1,250 level, while Silver has been up now for 9 weeks in a row and has conquered its 200 DMA, a sign of strong upward momentum. The dollar slipped, which was its 7th weekly drop out of the last 9.

Read More

Weekly StatSheet For The ETF Tracker Newsletter – Updated Through 02/23/2017

Ulli ETF StatSheet Contact

ETF Data updated through Thursday, February 23, 2017

Methodology/Use of this StatSheet:

  1. From the universe of over 1,800 ETFs, I have selected only those with a trading volume of over $5 million per day (HV ETFs), so that liquidity and a small bid/ask spread are assured.
  2. Trend Tracking Indexes (TTIs)

Buy or Sell decisions for Domestic and International ETFs (section 1 and 2), are made based on the respective TTI and its position either above or below its long-term M/A (Moving Average). A crossing of the trend line from below accompanied by some staying power above constitutes a “Buy” signal. Conversely, a clear break below the line constitutes a “Sell” signal. Additionally, I use a 7.5% trailing stop loss on all positions in these categories to control downside risk.

  1. All other investment arenas do not have a TTI and should be traded based on the position of the individual ETF relative to its own respective trend line (%M/A). That’s why those signals are referred to as a “Selective Buy.” In other words, if an ETF crosses its own trendline to the upside, a “Buy” signal is generated. Since these areas tend to be more volatile, I recommend a wider trailing sell stop of 7.5% -10% depending on your risk tolerance.

If you are unfamiliar with some of the terminology, please see Glossary of Terms and new subscriber information in section 9.


  1. DOMESTIC EQUITY ETFs: BUY — since 4/4/2016

Click on chart to enlarge

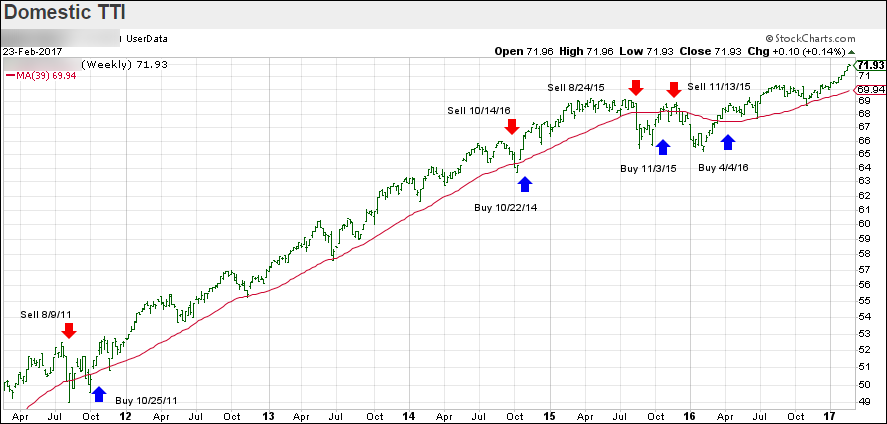
Our main directional indicator, the Domestic Trend Tracking Index (TTI-green line in the above chart) is positioned above its long-term trend line (red) by +2.97% after having generated a new Domestic Buy signal effective 4/4/2016 as posted.

Read More

Gold Jumps and Dollar Dumps

Ulli Market Commentary Contact

[Chart courtesy of MarketWatch.com]
  1. Moving the Markets

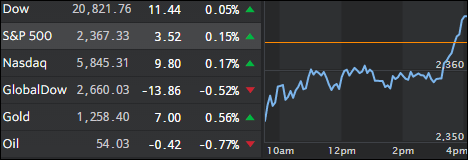
Thursday turned into a whip-saw kind of a day with the three major indexes vacillating above and below their respective unchanged lines but, in the end, the algos managed to push 2 out of 3 back into positive territory. Only the Nasdaq closed in the red, predominantly caused by weakness in Tesla.

Contributing to the uncertainty were statements by Treasury Secretary Mnuchin trying to throw some reality in this perceived economic nirvana that more details on the promised tax reform are not yet available. More importantly, he caught many of guard with his view that “new policies will have at best a limited impact in 2017,” and that he “doesn’t expect to see growth until 2018,” which are facts that I commented on two days ago. We will now have to wait and see if this disappointment carries over into the markets.

In summary, ZeroHedge explained it best: The market may soon pull a Wile E. Coyote—having scrambled too far, too fast, only to find itself suddenly with no firm ground below it, and the realization that any hope for a Trump tax plan to validate the recent move, will not be forthcoming for a long time.

Read More