ETFs On The Cutline – Updated Through 03/03/2017

Ulli ETFs on the Cutline Contact

Below please find the latest High Volume ETFs Cutline report, which shows how far above or below their respective long-term trend lines (39 week SMA) my currently tracked ETFs are positioned.

This report covers the HV ETF Master List from Thursday’s StatSheet and includes 366 High Volume ETFs ETFs, defined as those with an average daily volume of more than $5 million, of which currently 239 (last week 246) are hovering in bullish territory. The yellow line separates those ETFs that are positioned above their trend line (%M/A) from those that have dropped below it.

Take a look:

The HV ETF Master Cutline Report            

In case you are not familiar with some of the terminology used in the reports, please read the Glossary of Terms.

If you missed the original post about the Cutline approach, you can read it here.

ETF Tracker Newsletter For March 3, 2017

Ulli ETF Tracker Contact

ETF Tracker StatSheet

https://theetfbully.com/?p=18573&preview=true

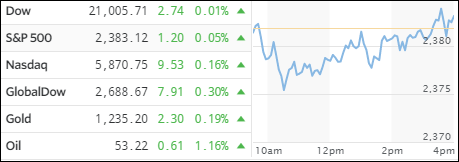
Clawing Back Above The Line

[Chart courtesy of MarketWatch.com]
  1. Moving the Markets

As we all know, you never get a straight answer from the Fed in regards to interest rates. Today was no exception as Fed head Yellen signaled that they are set raise rates this month, but they kept their options open via: “if employment and other economic data hold up.” Wall Street took that as an affirmative and rate hike odds ended up in the 95% area.

She added that “rates are likely to rise faster this year as the economy appears clear of any imminent hurdles at home or abroad for the first time in her tenure.” That is strange, because I see and have reported on weakening and not strengthening hard economic data points and simply can’t see a justification for a rate hike other than the Fed having cried “wolf” too many times.

Benefiting from higher rates are financial stocks, which were up +0.4%, while real estate was the worst performer with -0.4%. Interest rates were higher with the 30-year yield touching the 3.15% level twice before pulling back.

The S&P 500 and the Nasdaq closed out their 6th straight week of gains despite Thursday’s sell-off. As we have become accustomed to, the markets were down for most of the day, but thanks to the well-known last hour end-of-day acrobatics, the indexes were pushed above the unchanged line.

Read More

Weekly StatSheet For The ETF Tracker Newsletter – Updated Through 03/02/2017

Ulli ETF StatSheet Contact

ETF Data updated through Thursday, March 2, 2017

Methodology/Use of this StatSheet:

  1. From the universe of over 1,800 ETFs, I have selected only those with a trading volume of over $5 million per day (HV ETFs), so that liquidity and a small bid/ask spread are assured.
  2. Trend Tracking Indexes (TTIs)

Buy or Sell decisions for Domestic and International ETFs (section 1 and 2), are made based on the respective TTI and its position either above or below its long-term M/A (Moving Average). A crossing of the trend line from below accompanied by some staying power above constitutes a “Buy” signal. Conversely, a clear break below the line constitutes a “Sell” signal. Additionally, I use a 7.5% trailing stop loss on all positions in these categories to control downside risk.

  1. All other investment arenas do not have a TTI and should be traded based on the position of the individual ETF relative to its own respective trend line (%M/A). That’s why those signals are referred to as a “Selective Buy.” In other words, if an ETF crosses its own trendline to the upside, a “Buy” signal is generated. Since these areas tend to be more volatile, I recommend a wider trailing sell stop of 7.5% -10% depending on your risk tolerance.

If you are unfamiliar with some of the terminology, please see Glossary of Terms and new subscriber information in section 9.


  1. DOMESTIC EQUITY ETFs: BUY — since 4/4/2016

Click on chart to enlarge

Our main directional indicator, the Domestic Trend Tracking Index (TTI-green line in the above chart) is positioned above its long-term trend line (red) by +2.95% after having generated a new Domestic Buy signal effective 4/4/2016 as posted.

Read More

Coming Off The Sugar High

Ulli Market Commentary Contact

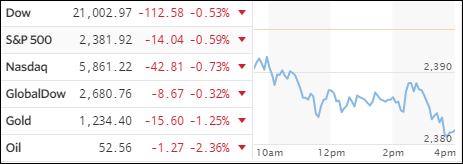
[Chart courtesy of MarketWatch.com]
  1. Moving the Markets

While the jury is still out in regards to me considering yesterday’s market ramp a “blow-off” top, today’s pullback did not come as a surprise with the major indexes having been on 12-day parabolic rampage supported by not a lot of real news to justify it.

Of course, today could have been a simple case of profit taking, which has been long overdue. Consider that ever since the election, any kind of selling has been met with relentless buying pushing stocks to new records highs for days on end, without as much as a 1% correction in over 90 trading days.

Today’s pullback took back about 50% of yesterday’s gains. In summary, interest rates rose and bonds got clobbered; gold got hammered while the US dollar rallied. Rate hike odds surged to 90% after the Fed mouthpieces Brainard, Williams, Dudley and Kaplan jawboned hawkish statements. Translation: It’s almost certain that a hike in March will happen when the Fed meets on March 15. But you never know for sure, so let’s wait and see if they actually follow through or if they start walking back market expectations—again.

Read More

WS Critic: “Trump Makes America ‘Wait’ Again”

Ulli Market Commentary Contact

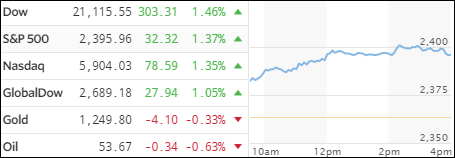
[Chart courtesy of MarketWatch.com]
  1. Moving the Markets

One of the funnier headlines I’ve seen in a while was featured by a Bloomberg writer, who in a note titled “Still No Details as Trump Makes America Wait Again” opined that, while the market was surging on a sugar high this morning, no details on how Trump plans to achieve his lofty goals were given.

Here’s the full note:

The longer the market has to process Trump’s speech, the less impressed it’ll be. It was rhetoric packed with hopes and dreams, but light on details and concrete plans.

Sadly, it feels like this outcome was all too predictable. Although, the possibility that he could have surprised us all means that the market has not yet fully priced in today’s disappointment.

Trump did manage to sound presidential and statesmanlike, and avoid getting bogged down in partisan or petty attacks. This is a positive.

It’s also supportive that infrastructure returned to the core of the agenda. Although, it seemed a resurrection of vague plans from three months ago rather than a step further along the path to implementing a program.

Financial bubbles, most notably the dotcom era, have proven that hopes and dreams can keep the market irrational longer than most of us can remain solvent.

At some point though, reality catches up. And 40 days in to Trump’s administration, there’s little sign that he’ll deliver much of a boost to the U.S. economy on any imminent horizon.

Optimistic soundbites from the speech don’t have the ability to drive the market higher on a sustainable basis. As analyst notes flow in to investors’ inboxes during the next 24 hours, asset prices may start reflecting a far more negative outcome.

Beware downside moves in the dollar, in U.S. yields, and even in equities. At some point, traders may realize the new emperor has no clothes.

While his view may turn out to ultimately be correct, right now the markets were surging to new all-time highs. A lot of support came from the bearish Wall Street crowd which had, in anticipation of a negative market reaction from Trump’s speech, engaged in setting up huge short positions that needed to be covered in a hurry this morning thereby supporting the bullish cause.

To me, today’s entire ramp had the smell of a “blow-off” top to it but, for the time being, upward momentum rules, and we will stay on board for the ride.

Read More

Snapping The Winning Streak

Ulli Market Commentary Contact

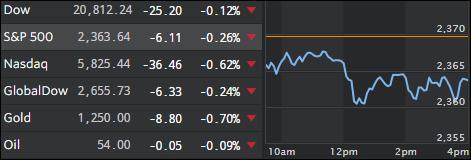
[Chart courtesy of MarketWatch.com]
  1. Moving the Markets

I did not expect much upside market action ahead of Trump’s speech, and that is exactly what happened. The Dow broke its 12-day record streak while all major indexes closed marginally to the downside. Not helping matters was Target’s report that profit for the quarter, including the holiday season, had fallen by an astonishing 43%. The punishment for such miss was immediate as the stock fell 12% pulling other retailers down as well.

For the short month of February, the major indexes gained with the S&P 500 sporting +3.7%, supported by hope that Trump’s promises of massive infrastructure spending, reduced regulations and tax reform will be forthcoming shortly. As I said yesterday, Wall Street will be analyzing his every word during tonight’s speech not only as to how he’s going to achieve those promises but just as importantly what the timeline will be along with how things will be paid for.

Remember, markets run on hope, optimism and euphoria. We’ll find out tonight if Trump can keep Wall Street appeased and thereby keep the rally going. Anything perception that he will not be able to deliver as promised will likely have a negative effect on market momentum.

Read More