
- Moving the Markets
The upward trend continued in the face of potential adversity such as the Eurozone’s political uncertainty, in part caused by the outcome of the Italian referendum, which so far has been treated as a non-event despite serious monetary ramifications. The ECB is on deck this week and scheduled to announce further monetary policy decisions.
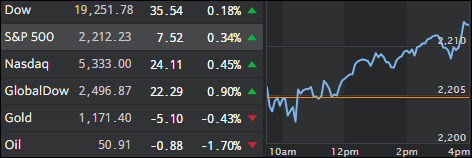
Domestically, all three major indexes were in “go” mode with the Nasdaq faring the best by adding +0.45% while Dow edged up only slightly but enough to notch another record closing high. Telecom and bank shares were the main contributors providing the fuel for the rally.
Still, the Fed is expected to raise rates next week, which could be a positive for the simple reason that the uncertainty and rhetoric about a rate hike will have finally come to an end leaving the only question unanswered as to the number of future rate hikes.
Hope on Wall Street continues that we have finally left the earnings recession and are back on track towards a period of earnings growth, which is sorely needed in order to justify the current lofty stock market valuations. If have my doubts whether this will be possible without first going through a healthy and long overdue market pullback.
- ETFs in the Spotlight
In case you missed the announcement and description of this section, you can read it here again.
It features 10 broadly diversified ETFs from my HighVolume list as posted every Monday. Furthermore, they are screened for the lowest MaxDD% number meaning they have been showing better resistance to temporary sell offs than all others over the past year.
Here are the 10 candidates:
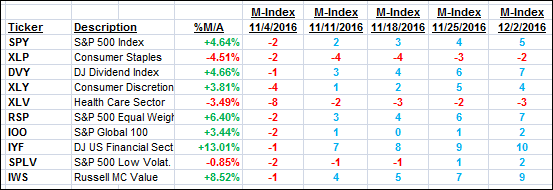
The above table simply demonstrates the magnitude with which some of the ETFs are fluctuating in regards to their positions above or below their respective individual trend lines (%M/A). A break below, represented by a negative number, shows weakness, while a break above, represented by a positive percentage, shows strength.
For hundreds of ETF choices, be sure to reference Thursday’s StatSheet.
Year to date, here’s how the above candidates have fared so far:
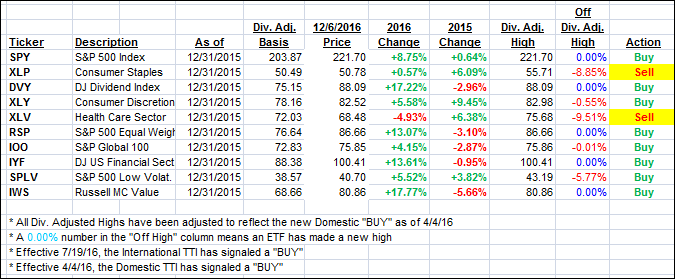
Again, the first table above shows the position of the various ETFs in relation to their respective long term trend lines (%M/A), while the second one tracks their trailing sell stops in the “Off High” column. The “Action” column will signal a “Sell” once the -7.5% point has been taken out in the “Off High” column.
- Trend Tracking Indexes (TTIs)
Our Trend Tracking Indexes (TTIs) rallied with the indexes and closed deeper on the bullish side of their respective trend lines.
Here’s how we closed 12/6/2016:
Domestic TTI: +0.89% (last close +0.71%)—Buy signal effective 4/4/2016
International TTI: +2.22% (last close +2.10%)—Buy signal effective 7/19/2016
Disclosure: I am obliged to inform you that I, as well as my advisory clients, own some of the ETFs listed in the above table. Furthermore, they do not represent a specific investment recommendation for you, they merely show which ETFs from the universe I track are falling within the guidelines specified.
Contact Ulli