
- Moving the Markets
Despite ECB’s Mario Draghi not exactly fulfilling the dreams of European traders by offering a mixed monetary policy decision via his announcement that his asset buys will be continued although at a reduced pace (from $80 billion a month to $60 billion), it did not matter. European markets rallied anyway with the German DAX adding another +1.75%. Again, we’re stuck in this scenario where any kind of news is a good thing.
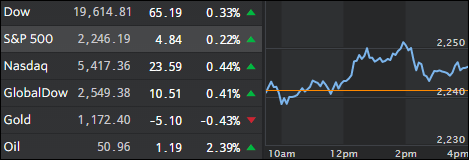
The US markets followed suit although at a lesser pace with the S&P 500 gaining +0.22%. Supporting today’s positive sentiment was a reduction in the number of Americans filing for unemployment benefits boosting hope that the labor market is strengthening. The post election optimism continues with full force as the path of least resistance has been higher.
A few days ago, I commented on the outcome of last weekend’s Italian referendum and the dire straits the entire Italian banking system finds itself in caused by $360 billion of non-performing loans. You’d think that this would be a further downer to Italian banking stocks, which have been demonstrating bearish behavior for quite some time now. Well, if you had thought that, you’d be dead wrong as Italian banks were the best stock market performer in the world this week. Take a look at this chart:
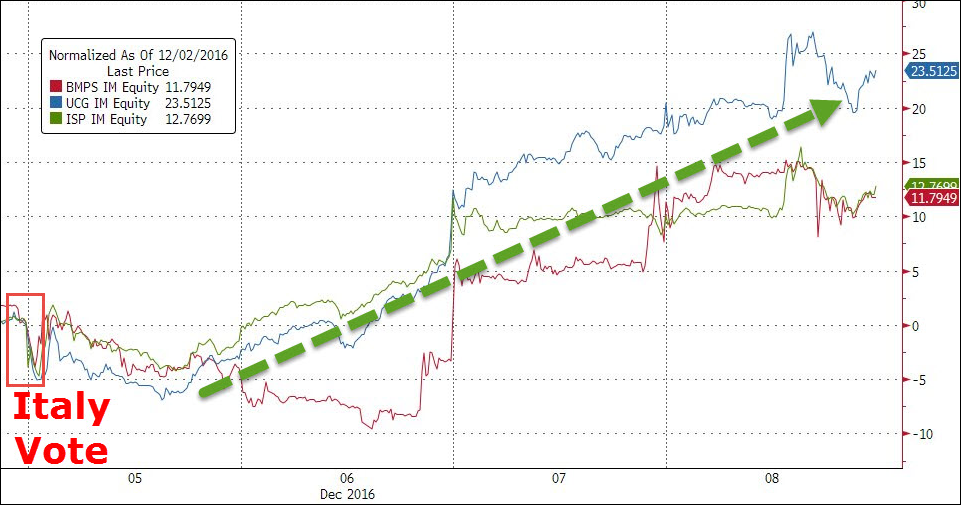 Chart courtesy of ZeroHedge
If it wasn’t such a serious matter, it would be funny. You simply can’t make this idiocy up.
- ETFs in the Spotlight
In case you missed the announcement and description of this section, you can read it here again.
It features 10 broadly diversified ETFs from my HighVolume list as posted every Monday. Furthermore, they are screened for the lowest MaxDD% number meaning they have been showing better resistance to temporary sell offs than all others over the past year.
Here are the 10 candidates:
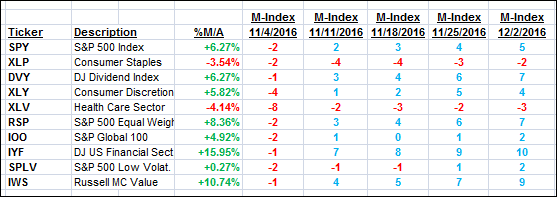
The above table simply demonstrates the magnitude with which some of the ETFs are fluctuating in regards to their positions above or below their respective individual trend lines (%M/A). A break below, represented by a negative number, shows weakness, while a break above, represented by a positive percentage, shows strength.
For hundreds of ETF choices, be sure to reference Thursday’s StatSheet.
Year to date, here’s how the above candidates have fared so far:
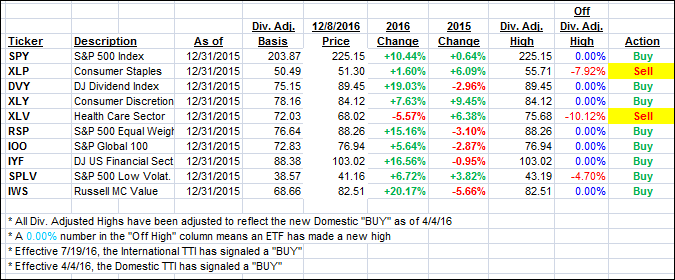
Again, the first table above shows the position of the various ETFs in relation to their respective long term trend lines (%M/A), while the second one tracks their trailing sell stops in the “Off High” column. The “Action” column will signal a “Sell” once the -7.5% point has been taken out in the “Off High” column.
- Trend Tracking Indexes (TTIs)
Our Trend Tracking Indexes (TTIs) edged higher as the bullish trend continued.
Here’s how we closed 12/8/2016:
Domestic TTI: +1.52% (last close +1.36%)—Buy signal effective 4/4/2016
International TTI: +3.56% (last close +3.56%)—Buy signal effective 7/19/2016
Disclosure: I am obliged to inform you that I, as well as my advisory clients, own some of the ETFs listed in the above table. Furthermore, they do not represent a specific investment recommendation for you, they merely show which ETFs from the universe I track are falling within the guidelines specified.
Contact Ulli