ETF Tracker Newsletter For March 17, 2017

Ulli ETF Tracker Contact

ETF Tracker StatSheet

https://theetfbully.com/2017/03/weekly-statsheet-etf-tracker-newsletter-updated-03162017/

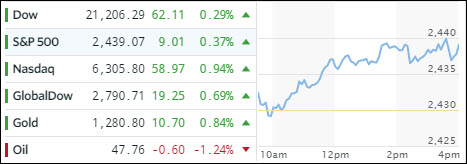
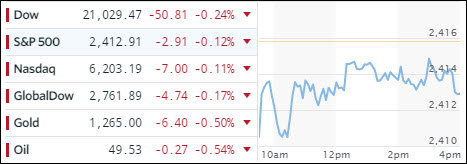
EQUITIES DIP AND DOLLAR PLUNGES

[Chart courtesy of MarketWatch.com]
  1. Moving the Markets

Stocks dipped slightly today but managed to squeeze out a gain for the week with the S&P 500 adding 5 points or 0.2%, which is not a particularly noteworthy performance but, given the uncertainty in Europe along with the Fed’s move on interest rates, we could have ended up far worse.

The US dollar, on the other hand, was not as fortunate and got clobbered resulting in its worst week in some 8 months. It is now down over 3% for this quarter. The yield on the benchmark 10-year Treasury came off its 30-month high of 2.62% and ended down 2.53%, causing a rebound in the bond market. That helped HYG (high yield bond ETF) to recover a bit and bounce of its major support trend line.

Financials had their 2nd worst week of the year while gold remained on its recent bullish path. Today was quadruple option expiration day, which results in higher than normal volume but also tends to distort price levels. With this now behind us, I am curious to see if other main issues such the debt ceiling debate, which certainly will affect market direction, will finally be addressed in the coming weeks.

Read More

Weekly StatSheet For The ETF Tracker Newsletter – Updated Through 03/16/2017

Ulli ETF StatSheet Contact

ETF Data updated through Thursday, March 16, 2017

Methodology/Use of this StatSheet:

  1. From the universe of over 1,800 ETFs, I have selected only those with a trading volume of over $5 million per day (HV ETFs), so that liquidity and a small bid/ask spread are assured.
  2. Trend Tracking Indexes (TTIs)

Buy or Sell decisions for Domestic and International ETFs (section 1 and 2), are made based on the respective TTI and its position either above or below its long-term M/A (Moving Average). A crossing of the trend line from below accompanied by some staying power above constitutes a “Buy” signal. Conversely, a clear break below the line constitutes a “Sell” signal. Additionally, I use a 7.5% trailing stop loss on all positions in these categories to control downside risk.

  1. All other investment arenas do not have a TTI and should be traded based on the position of the individual ETF relative to its own respective trend line (%M/A). That’s why those signals are referred to as a “Selective Buy.” In other words, if an ETF crosses its own trendline to the upside, a “Buy” signal is generated. Since these areas tend to be more volatile, I recommend a wider trailing sell stop of 7.5% -10% depending on your risk tolerance.

If you are unfamiliar with some of the terminology, please see Glossary of Terms and new subscriber information in section 9.


  1. DOMESTIC EQUITY ETFs: BUY — since 4/4/2016

Click on chart to enlarge

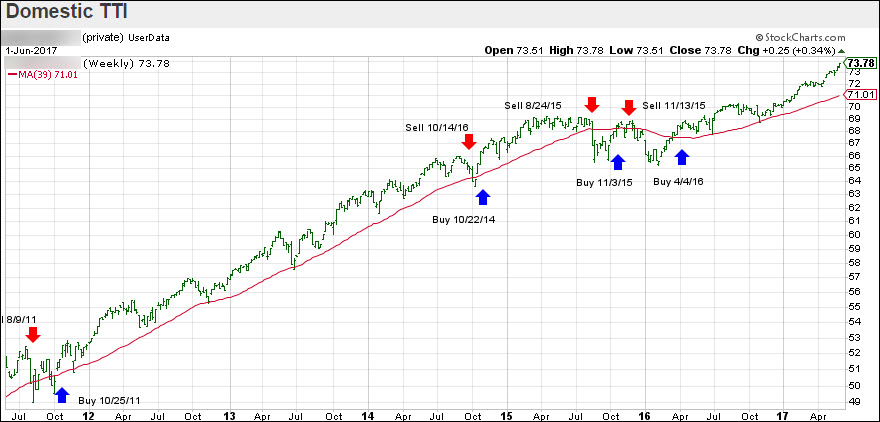
Our main directional indicator, the Domestic Trend Tracking Index (TTI-green line in the above chart) is positioned above its long-term trend line (red) by +3.08% after having generated a new Domestic Buy signal effective 4/4/2016 as posted.

Read More

Equities Edge Down As Gold Jumps

Ulli Market Commentary Contact

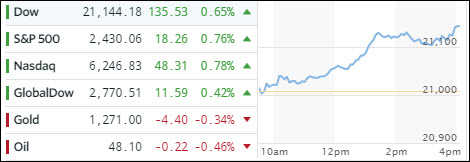
[Chart courtesy of MarketWatch.com]
  1. Moving the Markets

After yesterday’s “good news” by the Fed that interest rates will be hiked, which produced a nice rally, today’s action was range bound as the major indexes hovered close to the unchanged line with only the Nasdaq eking out a meager +0.01% gain. To get upward momentum soaring again, we need more news of a continuously weakening economy accompanied by much higher rates. Of course, I am being facetious, but you get the point…

The dollar (UUP) dropped again but only by a small margin (-0.35%) to reach a 6-week low. That, along with political uncertainty, was enough to send gold soaring again, and it rallied for the second day in a row by adding +2.13% and remaining solidly north of the $1,200 milestone marker. Silver joined the move and broke back above a key technical level.

Healthcare stocks suffered with the index dropping -0.9% as President Trump announced higher regulatory costs for the sector along with a cut in federal funding for medical research. Sure, those plans are a long ways away from becoming reality, but the theme at least for today was “it’s better to get out early with profits than sell later at a loss.”

Read More

Fed Raises Rates Despite Weakening GDP

Ulli Market Commentary Contact

[Chart courtesy of MarketWatch.com]
  1. Moving the Markets

You’d think that, as we’ve seen in the past, that a rate hike would cause the dollar to rally, but you would have been wrong. Instead, the greenback got absolutely hammered (see chart below) and lost -1.22% as the Fed stepped in and hiked interest rates by an expected 0.25%.

That hike came in the face of a weakening economy, a topic I have been pounding on for quite a while, which was confirmed by the Atlanta Fed GDPNOW forecast of 0.9% for the first quarter. If that number holds, it would be the weakest economic backdrop for the economy for a rate hike since 1980, according to Bloomberg.

None of that mattered as stocks took it as positive and off to the races we went with all major indexes, along with emerging markets, closing solidly in the green after the past few days of aimless meandering. The weakening dollar pulled gold out of the doldrums and even gave oil a nice kick upward for a change.

Back to the dollar: It plunged to 6-week lows, which is the biggest daily drop in the Bloomberg dollar index since the end of July. Take a look at the chart:

Read More

Uncertainty Reigns

Ulli Market Commentary Contact

[Chart courtesy of MarketWatch.com]
  1. Moving the Markets

Market nervousness and uncertainty prevailed as all eyes were feasted on the Fed ahead of their widely anticipated rate hike due to be announced tomorrow late morning. The longer term effect of such a hike remains subject to much speculation, as the Fed will be raising rates into a weakening economy with a GDP growth rate that is anything but awe inspiring.

Equities dropped with all 3 major indexes pulling back as the chart above shows; even gold couldn’t defend its $1,200 level and closed slightly below it. Bonds rallied as the yield on the 10-year Treasury bond dropped by 2 basis points to 2.60%.

The social media darling Snapchat (SNAP) continued to get hammered, and has not only surrendered its IPO rally, but closed deeply in the red below its IPO price. The canary in the coal mine, AKA the high yield corporate bond ETF (HYG), has been falling off a cliff and has broken its 200 day MA to the downside, the first time since Trump’s Election Day. Not a good sign for equities, since they tend to track high yield.

Take a look at the chart:

Read More

Drifting Nowhere

Ulli Market Commentary Contact

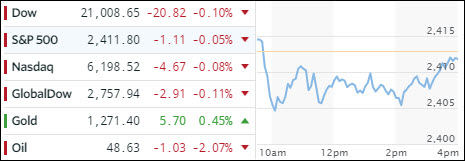
[Chart courtesy of MarketWatch.com]
  1. Moving the Markets

I did not except much market movement ahead of the Fed’s interest rate decision on Wednesday, and that’s exactly what happened as the major indexes vacillated in a tight range ending little changed on low volume.

Behind the scenes, some divergence has become apparent as the number of S&P companies above their 50-day M/A have turned lower indicating weakening momentum. The same reversal is noticeable when looking at the number of S&P companies above their 200-day M/A.

The US dollar slipped giving support to gold, and the 10-year Treasury yield spiked to 2.62%, its highest since December 2015. Should this continue and rates move towards the 3% level, there will be some fallout in the equities arena. Interest rates can’t simply race higher forever without consequences. The danger zone, as I have posted before, is between 2.6% and 3%, which is the area many top hedge fund managers are watching. Stay tuned…

Read More