One Man’s Opinion: The Seven Stages To A Bear Market For Bonds

Ulli Market Review Contact

By Michael Carino

We have just lived through the most spectacular global bull market run for the fixed income markets.  This bull market rallied the bond market to the lowest yields ever!  Over a third of all global fixed income was trading with a negative yield.  The most accommodative central bank policies made heroes out of bond fund managers. Bond investors that stayed fully invested with fingers crossed, hoping for the greater fool theory to eventually take them out of their overvalued position were rewarded handsomely.  These bond managers are now managing hundreds of billions in assets, have attained rock star status in the investment community and are living the life of Riley.  After such a spectacular run that has spanned a decade, most fixed income participants have never witnessed losses in their bond portfolios, never mind a bear market that lasts some time and delivers a good amount of pain.

This recent back-up in yields has left many bond investors confused, nervous and unsure what to expect. Well, rest assured, I’m here to assist. After 25 years managing bond portfolios and trading trillions of dollars in the bond market, I believe I have perfected my timing model that identifies when a bond market selloff has run its course.

This proprietary model stands out for being unique, intuitive and void of the quantitative modeling mistakes and biases.  The model is quite qualitative, psychologically driven and keys off the 7 stages of a bear market for bonds:

Read More

ETFs On The Cutline – Updated Through 03/10/2017

Ulli ETFs on the Cutline Contact

Below please find the latest High Volume ETFs Cutline report, which shows how far above or below their respective long-term trend lines (39 week SMA) my currently tracked ETFs are positioned.

This report covers the HV ETF Master List from Thursday’s StatSheet and includes 366 High Volume ETFs ETFs, defined as those with an average daily volume of more than $5 million, of which currently 217 (last week 239) are hovering in bullish territory. The yellow line separates those ETFs that are positioned above their trend line (%M/A) from those that have dropped below it.

Take a look:

The HV ETF Master Cutline Report            

In case you are not familiar with some of the terminology used in the reports, please read the Glossary of Terms.

If you missed the original post about the Cutline approach, you can read it here.
ETF Tracker Newsletter For March 10, 2017

Ulli ETF Tracker Contact

ETF Tracker StatSheet

https://theetfbully.com/?p=18630&preview=true

STRUGGLING FOR DIRECTION

[Chart courtesy of MarketWatch.com]
  1. Moving the Markets

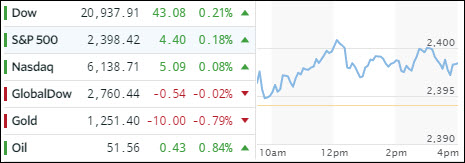
Struggling for direction was the theme only of the past week but also for today as the headline of the US adding 235k jobs in February ramped markets higher right out of the gate. Expectations of 200k were solidly beat and even the whisper expectation of 233k was conquered. The unemployment rate remained at 4.7%.

Despite the great headline number, the markets sold off mid-day as a look under the hood revealed that the growth in average hourly earnings came in at 0.2% MoM against expectations of a 0.3% increase. Still, on a YoY basis expectations were met. The bottom line is that the numbers should be good enough for the Fed to hike next week.

Here’s ZH with more details:

There has been a distinct shift in the composition of job gains in the first full job report under Donald Trump: whereas in the recent past, jobs under Obama were mainly focused in low-paying, minimum-wage categories, such as retail, hospitality, education and, of course, food service and drinking places, in February there was a notable change with some of Trump’s favorite sectors, such as manufacturing and construction posting dramatic gains.

Let’s wait and see if this potential game changer can generate enough momentum in the face of higher interest rates, a weakening retail sector, crashing crude oil, collapsing high yield bond prices and a slipping GDP that points decidedly in a southerly direction.

Other than that, everything is great, despite the rate hike odds for June having now grown to 50%. Go figure…

Read More

Weekly StatSheet For The ETF Tracker Newsletter – Updated Through 03/09/2017

Ulli ETF StatSheet Contact

ETF Data updated through Thursday, March 9, 2017

Methodology/Use of this StatSheet:

  1. From the universe of over 1,800 ETFs, I have selected only those with a trading volume of over $5 million per day (HV ETFs), so that liquidity and a small bid/ask spread are assured.
  2. Trend Tracking Indexes (TTIs)

Buy or Sell decisions for Domestic and International ETFs (section 1 and 2), are made based on the respective TTI and its position either above or below its long-term M/A (Moving Average). A crossing of the trend line from below accompanied by some staying power above constitutes a “Buy” signal. Conversely, a clear break below the line constitutes a “Sell” signal. Additionally, I use a 7.5% trailing stop loss on all positions in these categories to control downside risk.

  1. All other investment arenas do not have a TTI and should be traded based on the position of the individual ETF relative to its own respective trend line (%M/A). That’s why those signals are referred to as a “Selective Buy.” In other words, if an ETF crosses its own trendline to the upside, a “Buy” signal is generated. Since these areas tend to be more volatile, I recommend a wider trailing sell stop of 7.5% -10% depending on your risk tolerance.

If you are unfamiliar with some of the terminology, please see Glossary of Terms and new subscriber information in section 9.


  1. DOMESTIC EQUITY ETFs: BUY — since 4/4/2016

Click on chart to enlarge

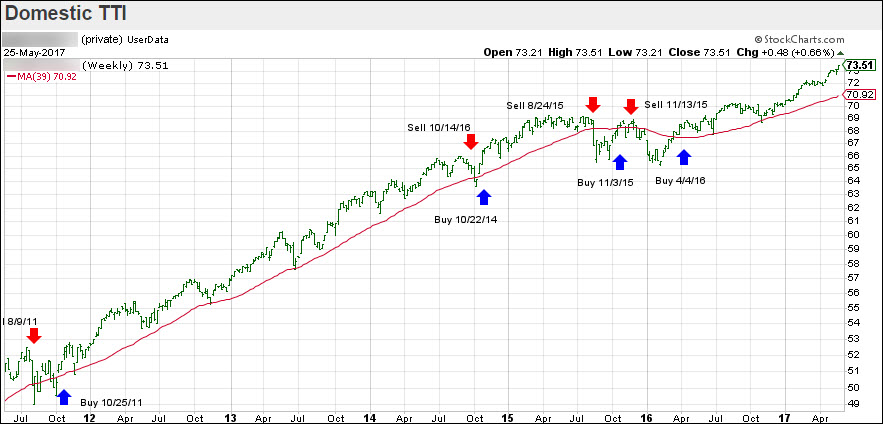
Our main directional indicator, the Domestic Trend Tracking Index (TTI-green line in the above chart) is positioned above its long-term trend line (red) by +2.51% after having generated a new Domestic Buy signal effective 4/4/2016 as posted.

Read More

Equities Eke Out A Small Gain; Bonds Get Clobbered

Ulli Market Commentary Contact

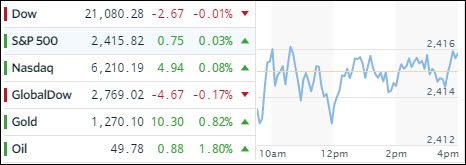
[Chart courtesy of MarketWatch.com]
  1. Moving the Markets

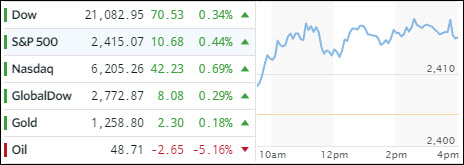
Another directionless day with the major indexes hovering below the unchanged line but a last minute ramp helped to get us into the green thereby avoiding a 6th straight loss for the Dow.

The indexes are now unchanged from Trump’s rally speech. Financial conditions remain tight with bonds having another ugly day as yields have now risen for 9 straight days. As ZH reports, the 10-year T-bond has not had a longer losing streak since 1974.

High yield credit too was negatively affected as well with the widely followed HYG ETF losing at the tune of -2.3% in March alone and breaking below its 50-day moving average.

There was not much strength anywhere as commodities headed south joined by precious metals and oil, which lost again after yesterday’s -5% drubbing.

The question in my mind is when will stocks notice? Especially in view of the fact that Macro data is deteriorating almost daily and GDP growth is also going the wrong way.

Read More

Oil Plunges; Market Weakness Continues

Ulli Market Commentary Contact

[Chart courtesy of MarketWatch.com]
  1. Moving the Markets

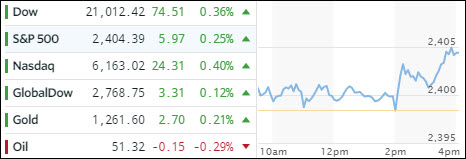
It was another mixed day in the markets as encouraging news via a stronger-than-expected ADP employment report was offset by a collapse in oil prices, which got hammered at the rate of -5.38%, their biggest drop in over a year, caused by a bearish inventory report.

The ADP report showed that private companies added the most jobs in three years in February (280k), which is interpreted as a sign of stronger economic growth. The U.S. government will issue its own broader jobs report on Friday, which will be the last reading before the Fed’s verdict on interest rates due out next week.

The 10-year yield jumped to 2.56% from 2.52% and is now in danger of crossing the 2.6% threshold level, which is widely associated with having a negative effect on equities. Of course, 2.6% is not a hard number, but a yield in the range of 2.6% to 3% is considered a warning sign; sort of the canary in the coalmine.

Ever since Trump’s speech to congress a week ago, the markets have been slipping and sliding, although the magnitude of the retreat has been small and only 0.9% as measured by the Dow. However, the sell-off has been broad based with macro data, emerging markets, copper, high-yield credit, REITs and crude oil all breaking down as “derisking” seems to have been the mantra.

For the time being, however, the major trend in the domestic investment arena, with the exception of a few sectors, remains bullish as my TTI indicator in section 3 below shows.

Read More