
- Moving the Markets
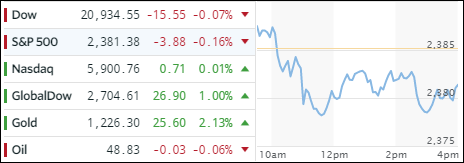
After yesterday’s “good news” by the Fed that interest rates will be hiked, which produced a nice rally, today’s action was range bound as the major indexes hovered close to the unchanged line with only the Nasdaq eking out a meager +0.01% gain. To get upward momentum soaring again, we need more news of a continuously weakening economy accompanied by much higher rates. Of course, I am being facetious, but you get the point…
The dollar (UUP) dropped again but only by a small margin (-0.35%) to reach a 6-week low. That, along with political uncertainty, was enough to send gold soaring again, and it rallied for the second day in a row by adding +2.13% and remaining solidly north of the $1,200 milestone marker. Silver joined the move and broke back above a key technical level.
Healthcare stocks suffered with the index dropping -0.9% as President Trump announced higher regulatory costs for the sector along with a cut in federal funding for medical research. Sure, those plans are a long ways away from becoming reality, but the theme at least for today was “it’s better to get out early with profits than sell later at a loss.”
- ETFs in the Spotlight (updated for 2017)
In case you missed the announcement and description of this section, you can read it here again.
It features 10 broadly diversified and sector ETFs from my HighVolume list as posted every Saturday. Furthermore, they are screened for the lowest MaxDD% number meaning they have been showing better resistance to temporary sell offs than all others over the past year.
The below table simply demonstrates the magnitude with which some of the ETFs are fluctuating in regards to their positions above or below their respective individual trend lines (%M/A). A break below, represented by a negative number, shows weakness, while a break above, represented by a positive percentage, shows strength.
For hundreds of ETF choices, be sure to reference Thursday’s StatSheet.
Year to date, here’s how the 2017 candidates have fared so far:
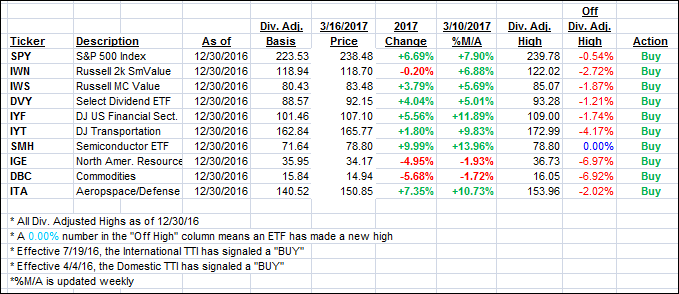
Again, the %M/A column above shows the position of the various ETFs in relation to their respective long term trend lines, while the trailing sell stops are being tracked in the “Off High” column. The “Action” column will signal a “Sell” once the -7.5% point has been taken out in the “Off High” column.
- Trend Tracking Indexes (TTIs)
Our Trend Tracking Indexes (TTIs) were mixed with the Domestic one pulling back a tad while the International one headed north.
Here’s how we closed 3/16/2017:
Domestic TTI: +3.08% (last close +3.12%)—Buy signal effective 4/4/2016
International TTI: +6.81% (last close +6.32%)—Buy signal effective 7/19/2016
Disclosure: I am obliged to inform you that I, as well as my advisory clients, own some of the ETFs listed in the above table. Furthermore, they do not represent a specific investment recommendation for you, they merely show which ETFs from the universe I track are falling within the guidelines specified.
Contact Ulli