
- Moving the Markets
You’d think that, as we’ve seen in the past, that a rate hike would cause the dollar to rally, but you would have been wrong. Instead, the greenback got absolutely hammered (see chart below) and lost -1.22% as the Fed stepped in and hiked interest rates by an expected 0.25%.
That hike came in the face of a weakening economy, a topic I have been pounding on for quite a while, which was confirmed by the Atlanta Fed GDPNOW forecast of 0.9% for the first quarter. If that number holds, it would be the weakest economic backdrop for the economy for a rate hike since 1980, according to Bloomberg.
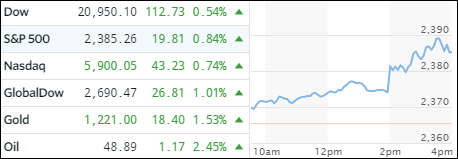
None of that mattered as stocks took it as positive and off to the races we went with all major indexes, along with emerging markets, closing solidly in the green after the past few days of aimless meandering. The weakening dollar pulled gold out of the doldrums and even gave oil a nice kick upward for a change.
Back to the dollar: It plunged to 6-week lows, which is the biggest daily drop in the Bloomberg dollar index since the end of July. Take a look at the chart:
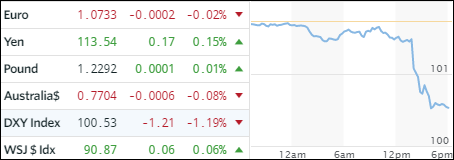
Dollar weakness sent commodities higher but banks were the whipping boys of this event with Goldman Sachs now down for 8 straight days, its longest losing streak since 2008.
- ETFs in the Spotlight (updated for 2017)
In case you missed the announcement and description of this section, you can read it here again.
It features 10 broadly diversified and sector ETFs from my HighVolume list as posted every Saturday. Furthermore, they are screened for the lowest MaxDD% number meaning they have been showing better resistance to temporary sell offs than all others over the past year.
The below table simply demonstrates the magnitude with which some of the ETFs are fluctuating in regards to their positions above or below their respective individual trend lines (%M/A). A break below, represented by a negative number, shows weakness, while a break above, represented by a positive percentage, shows strength.
For hundreds of ETF choices, be sure to reference Thursday’s StatSheet.
Year to date, here’s how the 2017 candidates have fared so far:
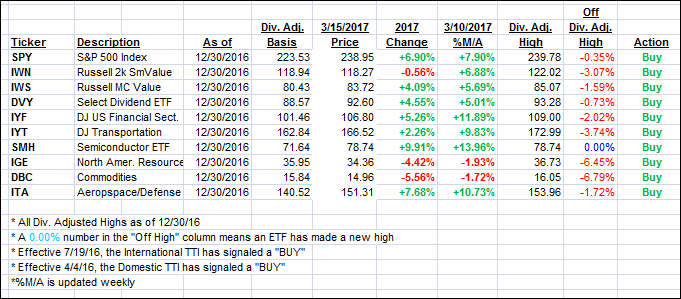
Again, the %M/A column above shows the position of the various ETFs in relation to their respective long term trend lines, while the trailing sell stops are being tracked in the “Off High” column. The “Action” column will signal a “Sell” once the -7.5% point has been taken out in the “Off High” column.
- Trend Tracking Indexes (TTIs)
Our Trend Tracking Indexes (TTIs) rallied with the indexes and closed deeper into bullish territory.
Here’s how we closed 3/15/2017:
Domestic TTI: +3.12% (last close +2.66%)—Buy signal effective 4/4/2016
International TTI: +6.32% (last close +5.34%)—Buy signal effective 7/19/2016
Disclosure: I am obliged to inform you that I, as well as my advisory clients, own some of the ETFs listed in the above table. Furthermore, they do not represent a specific investment recommendation for you, they merely show which ETFs from the universe I track are falling within the guidelines specified.
Contact Ulli