
- Moving the Markets
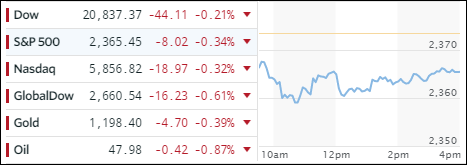
Market nervousness and uncertainty prevailed as all eyes were feasted on the Fed ahead of their widely anticipated rate hike due to be announced tomorrow late morning. The longer term effect of such a hike remains subject to much speculation, as the Fed will be raising rates into a weakening economy with a GDP growth rate that is anything but awe inspiring.
Equities dropped with all 3 major indexes pulling back as the chart above shows; even gold couldn’t defend its $1,200 level and closed slightly below it. Bonds rallied as the yield on the 10-year Treasury bond dropped by 2 basis points to 2.60%.
The social media darling Snapchat (SNAP) continued to get hammered, and has not only surrendered its IPO rally, but closed deeply in the red below its IPO price. The canary in the coal mine, AKA the high yield corporate bond ETF (HYG), has been falling off a cliff and has broken its 200 day MA to the downside, the first time since Trump’s Election Day. Not a good sign for equities, since they tend to track high yield.
Take a look at the chart:
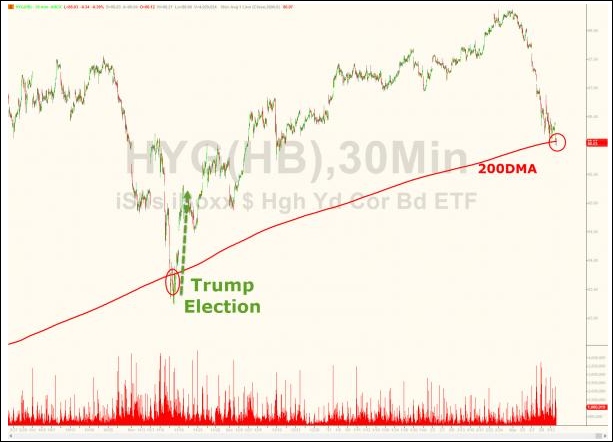
Chart courtesy of ZeroHedge
- ETFs in the Spotlight (updated for 2017)
In case you missed the announcement and description of this section, you can read it here again.
It features 10 broadly diversified and sector ETFs from my HighVolume list as posted every Saturday. Furthermore, they are screened for the lowest MaxDD% number meaning they have been showing better resistance to temporary sell offs than all others over the past year.
The below table simply demonstrates the magnitude with which some of the ETFs are fluctuating in regards to their positions above or below their respective individual trend lines (%M/A). A break below, represented by a negative number, shows weakness, while a break above, represented by a positive percentage, shows strength.
For hundreds of ETF choices, be sure to reference Thursday’s StatSheet.
Year to date, here’s how the 2017 candidates have fared so far:
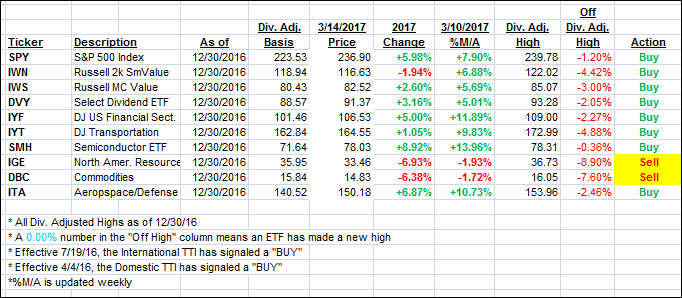
Again, the %M/A column above shows the position of the various ETFs in relation to their respective long term trend lines, while the trailing sell stops are being tracked in the “Off High” column. The “Action” column will signal a “Sell” once the -7.5% point has been taken out in the “Off High” column.
- Trend Tracking Indexes (TTIs)
Our Trend Tracking Indexes (TTIs) dipped a little as uncertainly ahead of the Fed’s rate hike pulled the major indexes lower.
Here’s how we closed 3/14/2017:
Domestic TTI: +2.66% (last close +2.76%)—Buy signal effective 4/4/2016
International TTI: +5.34% (last close +5.79%)—Buy signal effective 7/19/2016
Disclosure: I am obliged to inform you that I, as well as my advisory clients, own some of the ETFs listed in the above table. Furthermore, they do not represent a specific investment recommendation for you, they merely show which ETFs from the universe I track are falling within the guidelines specified.
Contact Ulli