ETF Tracker Newsletter For May 5, 2017

Ulli ETF Tracker Contact

ETF Tracker StatSheet

https://theetfbully.com/2017/05/weekly-statsheet-etf-tracker-newsletter-updated-05042017/

TUG OF WAR: STRONG JOBS REPORT VS. FRENCH ELECTIONS

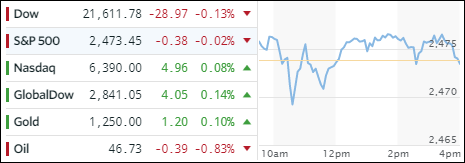
[Chart courtesy of MarketWatch.com]
  1. Moving the Markets

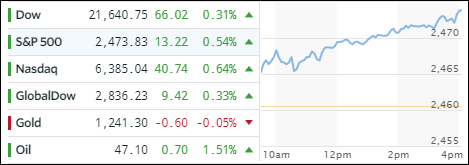
It was a tug of war as a strong jobs report battled for market direction against the uncertainty of the second and final round of the upcoming French elections. For the day, the on the surface positives of the jobs report were the winner as equities picked up some stream and closed higher with the S&P 500 knocking on the 2,400 milestone marker.

The jobs report showed that April payrolls jumped by 211,000 beating expectations and providing some relief after March’s disappointing revised 79,000 number. The disappointing part was that, despite strong jobs growth, hourly earnings were soft rising only 2.5% YoY vs. an expected 2.7%. So, why is it that in a labor market with alleged full employment wages simply can’t rise? The answer is clear and has to do with the quality of jobs, as most of them once again were in low or minimum-wage sectors aka waiters and bartenders.

ZH summed up today’s session as follows:

Massive liquidity issues in China wealth product liquidation, commodities crashing, oil plunging, US macro data disappointments, US earnings disappointments, and Buffett dumping Big Blue – only makes sense that The Dow just had its quietest 8 days since 1952!

US Macro data has negatively surprised for 7 straight weeks – dropping to its weakest since October…

Shown in a graph, it looks like this:

Read More

Weekly StatSheet For The ETF Tracker Newsletter – Updated Through 05/04/2017

Ulli ETF StatSheet Contact

ETF Data updated through Thursday, May 4, 2017

Methodology/Use of this StatSheet:

  1. From the universe of over 1,800 ETFs, I have selected only those with a trading volume of over $5 million per day (HV ETFs), so that liquidity and a small bid/ask spread are assured.
  2. Trend Tracking Indexes (TTIs)

Buy or Sell decisions for Domestic and International ETFs (section 1 and 2), are made based on the respective TTI and its position either above or below its long-term M/A (Moving Average). A crossing of the trend line from below accompanied by some staying power above constitutes a “Buy” signal. Conversely, a clear break below the line constitutes a “Sell” signal. Additionally, I use a 7.5% trailing stop loss on all positions in these categories to control downside risk.

  1. All other investment arenas do not have a TTI and should be traded based on the position of the individual ETF relative to its own respective trend line (%M/A). That’s why those signals are referred to as a “Selective Buy.” In other words, if an ETF crosses its own trendline to the upside, a “Buy” signal is generated. Since these areas tend to be more volatile, I recommend a wider trailing sell stop of 7.5% -10% depending on your risk tolerance.

If you are unfamiliar with some of the terminology, please see Glossary of Terms and new subscriber information in section 9.


  1. DOMESTIC EQUITY ETFs: BUY — since 4/4/2016
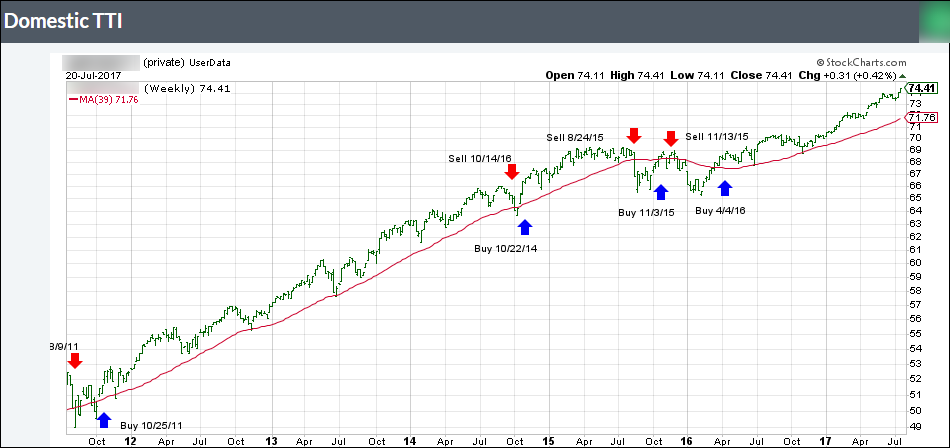
Click on chart to enlarge

Our main directional indicator, the Domestic Trend Tracking Index (TTI-green line in the above chart) is positioned above its long-term trend line (red) by +3.41% after having generated a new Domestic Buy signal effective 4/4/2016 as posted.
Read More

Choppy And Sloppy: Poor Macro Data; Equities Yawn; Oil Gets Spanked

Ulli Market Commentary Contact

[Chart courtesy of MarketWatch.com]
  1. Moving the Markets

It was a choppy session with macro data serving another notice that economic conditions are weakening, a theme I have been pounding on for quite some time. Today, things started with disappointing U.S productivity, the key to a high living standard, which declined at an annual pace of 0.6% for the 1st quarter 2017 (far worse than the expected 0.1% decline).

That was followed by another hard data miss, namely factory orders that rose 0.2%, which was half of the expected gain of 0.4%. The core orders (without transportation) looked worse, as they stumbled 0.3% the biggest drop since February 2016.

The third try turned out to be a charm as Obamacare was successfully repealed but faces serious senate bickering, which may lead to a significant rewrite of the legislation.

Equities were muted and danced around the unchanged line all day with nothing to show for. The loser of the day award goes to Oil, which was spanked at the tune of -4.87% closing below $46/barrel.

With June rate hike odds still hovering at 90%, it came as no surprise that Treasury yields rose with the 10-year adding 3 basis points to 2.36%, which is quite a jump off the recent 2.18% lows. The US dollar (UUP) slipped and has now clearly broken below its 200-day M/A. While the dollar and the S&P 500 roughly move in sync, that relationship has widened as the chart shows:

Read More

Looking For Direction

Ulli Market Commentary Contact

[Chart courtesy of MarketWatch.com]
  1. Moving the Markets

It was a mixed day with the major indexes looking for a catalyst that never materialized. Equities meandered, and only the Dow managed to eke out a meager gain of +0.04%. It’s been a sideways pattern with the S&P 500 closing 2,388, 2,387, 2,388, 2,384, 2,388, 2,391 and 2,387 over the past 7 days. Hat tip goes to ZH for these stats.

The Fed’s announcement of the direction of interest rates turned out as expected and was confirmed by their decision to keep monetary policy steady, however, the odds of a June rate hike jumped to 90%.

So, what about the atrocious 1st qtr GDP growth of 0.7%? The Fed simply dismissed it as likely to be “transitory” and focused on assuring that job gains were “solid”, indicating that they would remain on track to raise rates at a “gradual” pace. We’ll have to wait and see how that turns out.

With the Fed more or less confirming their future rate hike intentions, it’s no surprise that Treasury yields headed north with 10-year closing at 2.33%; the US dollar jumped with UUP adding +0.39%, while precious metals continued with their recent downward trend with gold sinking to 6 week lows.

Read More

Dismal Economic Data: Bonds Rally; Equities Inch Up

Ulli Market Commentary Contact

[Chart courtesy of MarketWatch.com]
  1. Moving the Markets

Economic data point releases were anything but awe inspiring with auto sales looking “less like a plateau and more like debt-fueled bubble on the verge of an epic collapse,” as ZH succinctly put it. Even hope for an April surprise ended in disappointment as OEMs did not even come close to estimates. Other factoids included sluggish consumer spending, reduced lending activity and slipping earnings expectations.

As a result, it’s no surprise that equities went back into a sideways trading range with uncertainty about Apple’s earnings and the Fed announcement being on traders’ minds. Still, the major indexes were pushed higher into the close via a VIX (volatility index) slam thereby assuring a “green” close.

Automakers headed south joined by banks as Trump’s break-up chatter (of the too big to fail banks) was on everyone’s minds. Bonds rallied with TLT gaining +0.51% while the US dollar went sideways and continues to hug its 200-day M/A. The energy complex got hammered again stumbling to their lowest since November; oil continued its slide and has now reached 6-month lows.

Read More

Tech Sector Saves The Day

Ulli Market Commentary Contact

[Chart courtesy of MarketWatch.com]
  1. Moving the Markets

While the Nasdaq and S&P 500 hovered above their respective unchanged lines all day, the Dow see-sawed and dove into the close for a slight loss. The Nasdaq was the savior with a solid +0.73% gain, but it also threw an assist to the S&P thereby helping it to close in the green. However, volume was the lowest of 2017 and 40% below 2016’s May Day volume.

Economic data points for manufacturing and personal income/spending were less than expected contributing to the loss of upward momentum, which dominated market sentiment all of last week.

Caution was the word of the day in the markets as a variety of upcoming events certainly could upset the bullish crowd. Here are some of them:

  1. Fed decision on interest rates (Wed)
  2. The April Labor report (Fri)
  3. The ongoing Debt Ceiling debacle (Fri)
  4. The second round of the French elections with the run off scheduled for this coming Sunday

Read More