
- Moving the Markets
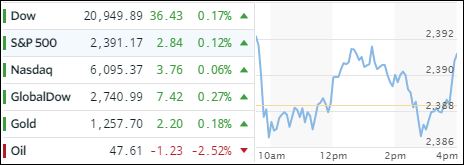
Economic data point releases were anything but awe inspiring with auto sales looking “less like a plateau and more like debt-fueled bubble on the verge of an epic collapse,” as ZH succinctly put it. Even hope for an April surprise ended in disappointment as OEMs did not even come close to estimates. Other factoids included sluggish consumer spending, reduced lending activity and slipping earnings expectations.
As a result, it’s no surprise that equities went back into a sideways trading range with uncertainty about Apple’s earnings and the Fed announcement being on traders’ minds. Still, the major indexes were pushed higher into the close via a VIX (volatility index) slam thereby assuring a “green” close.
Automakers headed south joined by banks as Trump’s break-up chatter (of the too big to fail banks) was on everyone’s minds. Bonds rallied with TLT gaining +0.51% while the US dollar went sideways and continues to hug its 200-day M/A. The energy complex got hammered again stumbling to their lowest since November; oil continued its slide and has now reached 6-month lows.
- ETFs in the Spotlight (updated for 2017)
In case you missed the announcement and description of this section, you can read it here again.
It features 10 broadly diversified and sector ETFs from my HighVolume list as posted every Saturday. Furthermore, they are screened for the lowest MaxDD% number meaning they have been showing better resistance to temporary sell offs than all others over the past year.
The below table simply demonstrates the magnitude with which some of the ETFs are fluctuating in regards to their positions above or below their respective individual trend lines (%M/A). A break below, represented by a negative number, shows weakness, while a break above, represented by a positive percentage, shows strength.
For hundreds of ETF choices, be sure to reference Thursday’s StatSheet.
Year to date, here’s how the 2017 candidates have fared so far:
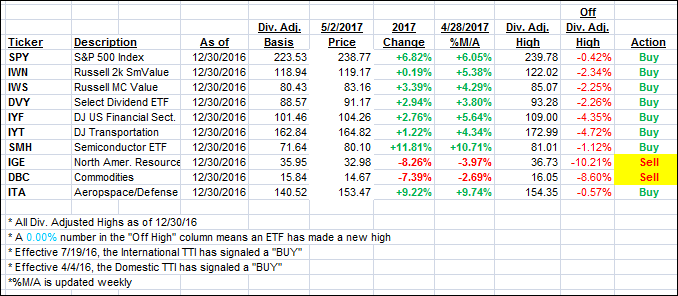
Again, the %M/A column above shows the position of the various ETFs in relation to their respective long term trend lines, while the trailing sell stops are being tracked in the “Off High” column. The “Action” column will signal a “Sell” once the -7.5% point has been taken out in the “Off High” column.
- Trend Tracking Indexes (TTIs)
Our Trend Tracking Indexes (TTIs) moved higher with the International one showing better upward momentum for the day.
Here’s how we closed 5/2/2017:
Domestic TTI: +3.40% (last close +3.30%)—Buy signal effective 4/4/2016
International TTI: +7.60% (last close +7.07%)—Buy signal effective 7/19/2016
Disclosure: I am obliged to inform you that I, as well as my advisory clients, own some of the ETFs listed in the above table. Furthermore, they do not represent a specific investment recommendation for you, they merely show which ETFs from the universe I track are falling within the guidelines specified.
Contact Ulli