
- Moving the Markets
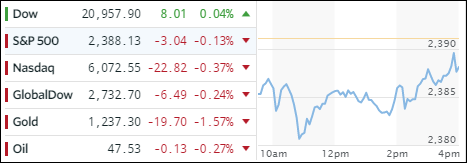
It was a mixed day with the major indexes looking for a catalyst that never materialized. Equities meandered, and only the Dow managed to eke out a meager gain of +0.04%. It’s been a sideways pattern with the S&P 500 closing 2,388, 2,387, 2,388, 2,384, 2,388, 2,391 and 2,387 over the past 7 days. Hat tip goes to ZH for these stats.
The Fed’s announcement of the direction of interest rates turned out as expected and was confirmed by their decision to keep monetary policy steady, however, the odds of a June rate hike jumped to 90%.
So, what about the atrocious 1st qtr GDP growth of 0.7%? The Fed simply dismissed it as likely to be “transitory” and focused on assuring that job gains were “solid”, indicating that they would remain on track to raise rates at a “gradual” pace. We’ll have to wait and see how that turns out.
With the Fed more or less confirming their future rate hike intentions, it’s no surprise that Treasury yields headed north with 10-year closing at 2.33%; the US dollar jumped with UUP adding +0.39%, while precious metals continued with their recent downward trend with gold sinking to 6 week lows.
- ETFs in the Spotlight (updated for 2017)
In case you missed the announcement and description of this section, you can read it here again.
It features 10 broadly diversified and sector ETFs from my HighVolume list as posted every Saturday. Furthermore, they are screened for the lowest MaxDD% number meaning they have been showing better resistance to temporary sell offs than all others over the past year.
The below table simply demonstrates the magnitude with which some of the ETFs are fluctuating in regards to their positions above or below their respective individual trend lines (%M/A). A break below, represented by a negative number, shows weakness, while a break above, represented by a positive percentage, shows strength.
For hundreds of ETF choices, be sure to reference Thursday’s StatSheet.
Year to date, here’s how the 2017 candidates have fared so far:
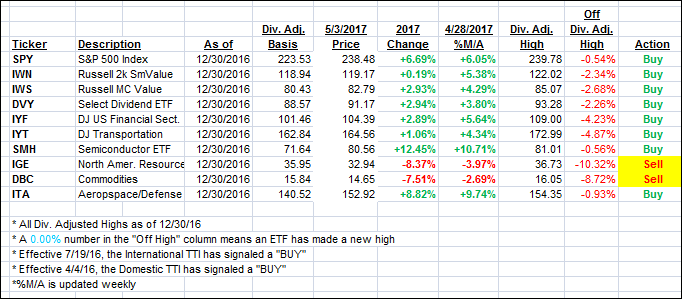
Again, the %M/A column above shows the position of the various ETFs in relation to their respective long term trend lines, while the trailing sell stops are being tracked in the “Off High” column. The “Action” column will signal a “Sell” once the -7.5% point has been taken out in the “Off High” column.
- Trend Tracking Indexes (TTIs)
Our Trend Tracking Indexes (TTIs) pulled back as the major indexes went nowhere.
Here’s how we closed 5/3/2017:
Domestic TTI: +3.32% (last close +3.40%)—Buy signal effective 4/4/2016
International TTI: +7.26% (last close +7.60%)—Buy signal effective 7/19/2016
Disclosure: I am obliged to inform you that I, as well as my advisory clients, own some of the ETFs listed in the above table. Furthermore, they do not represent a specific investment recommendation for you, they merely show which ETFs from the universe I track are falling within the guidelines specified.
Contact Ulli