Equities Skid But Dip Buyers Save The Day; Is China The Canary In The Coalmine?

Ulli Market Commentary Contact

[Chart courtesy of MarketWatch.com]
  1. Moving the Markets

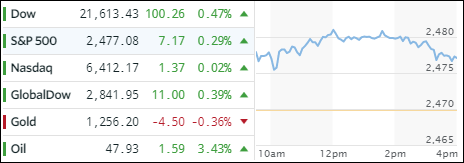
Right out of the gate, the major indexes skidded with the S&P 500 dropping -0.75% before the dip buying crowd (or was it the Fed?) stepped in to save the day. While we still closed below the unchanged line, the early losses were reduced. Nevertheless, after the almost comatose state of the markets of the past 2 weeks, the VIX finally showed some signs of life but was subdued by the end of the session.

Weaker than expected earnings and a slumping retail sector along with worries about possible delays in Trump’s pro-business agenda kept buying appetite in check. The retail bloodbath continued with Macy’s stock crashing after store sales tumbled worse than the already low consensus estimate.

US producer prices spiked the most in 5 years and have now, for third month in a row, risen faster than the Fed’s mandate. Interestingly, they are well above the highest analysts’ estimates despite dis-inflationary pressures from China being seen in industrial metals.

In regards to China, when looking at the global picture of YTD equity performance, one stands out, unfortunately as a bad example. Take a look at this revealing chart:

Read More

Still Riding The Range

Ulli Market Commentary Contact

[Chart courtesy of MarketWatch.com]
  1. Moving the Markets

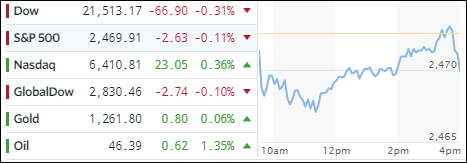
While the Nasdaq managed to ease higher by just enough of a margin to register a new record close for the 4th straight day, the Dow slipped a tad but the S&P managed to bounce against its 2,400 glass ceiling without breaking it.

The Dow suffered a bit from a stock slide in Boeing following headlines that the 737 Max flight will be temporarily suspended due to engine issues. Also not helping the Dow was a news report about Apple experiencing production delays.

Of course, the headlines du jour were all about Trump’s dismissal of FBI head Comey, which surprisingly did not appear to have any market impact following the meme of the past couple of years that “any news is good news.” The VIX remained subdued and has now closed for 13 consecutive days below 11 thereby enabling the major indexes to continue hovering in nosebleed territory.

Interest rates rose a tad with the 20-year Treasury Bond ETF (TLT) losing -0.12%; the US dollar went the opposite way and added +0.12% to now remain firmly above its 200-day M/A after recently having dropped below it.

Read More

Indexes Flat But Nasdaq Notches A New Record

Ulli Market Commentary Contact

[Chart courtesy of MarketWatch.com]
  1. Moving the Markets

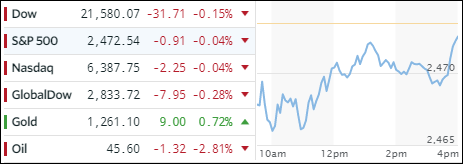
It was another non-eventful day in the markets with the Dow and S&P inching lower, however, the Nasdaq managed to eked out a new high. While earnings reports have been holding up, the spanking being dished out almost daily in the oil market along with opinions from the various Fed mouthpieces kept the markets in a tight trading range.

For sure, a new catalyst is needed to push markets higher, although these days just the absence of bad news could be enough to send the indexes nibbling at new all-time highs. However, given the almost daily load of deteriorating economic fundamentals, the odds are increasing that eventually gravity will take over and pull the indexes off their lofty levels down to a point that represents reality, which has been sorely lacking.

Has upside momentum started to slow down? It depends what indicators you look at. Our Trend Tracking Indexes (TTIs) represent the big long-term picture, and they are firmly entrenched on the bullish side of their respective trend lines. Of course, I am always looking for the canary in the coalmine that might give me some short-term indication of waning momentum.

One of those short-term indicators in regards to the S&P 500 is the change in the number of companies above their 50-day and 200-day moving averages. Take a look at this 6-month chart:

Read More

Apple Hits $800 Billion Market Cap; Major Indexes Unchanged

Ulli Market Commentary Contact

[Chart courtesy of MarketWatch.com]
  1. Moving the Markets

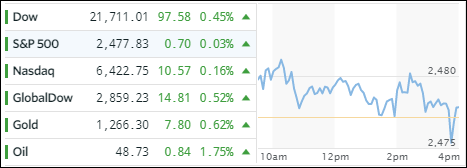
The major indexes spent today’s session in a tight range and clung to the unchanged line for most of the day. The outcome of the French elections sparked a “sell the news theme,” but US markets were stuck in a no volatility environment as the VIX was pushed down to its lowest close since December 1993, if you can believe that.

That is a condition that simply can’t last for very long but controlling the VIX is a great tool to manage any potential market sell-offs and keeping the bullish hope alive. In the absence of such control, we may see a repeat of what happened from January to March 1994 when the VIX jumped from 9.59 to over 28; by the way, the S&P 500 fell 10% during that period.

Apple was the big dog today with its stock rallying 3% likely in part based on news that Warren Buffett had sharply increased his stake in the company during the last quarter. Apple contributed to adding around 30 points to the Dow and broke the $800 billion market cap for the first time.

Read More

One Man’s Opinion: Waiter And Bartender Jobs Surge In The Land Of The Free

Ulli Market Review Contact

By Simon Black

The headline in the New York Times today read “U.S. Job Growth Bounces Back; Unemployment at 10-Year Low”.

That’s certainly one way of looking at it.

The US Department of Labor released its regular jobs report this morning showing the official unemployment rate is just 4.4% in the Land of the Free.

That’s certainly a strong number; I’m sure plenty of people in Venezuela and Turkey would love to have an unemployment rate at even twice that figure.

But when you actually dive into the statistics, the optimism starts to fade a bit.

It turns out that the #1 driver of job growth in the United States is “Leisure and Hospitality”, which is how the Department of Labor categorizes food service jobs.

That basically means waiters and bartenders.

Read More

ETFs On The Cutline – Updated Through 05/05/2017

Ulli ETFs on the Cutline Contact

Below please find the latest High Volume ETFs Cutline report, which shows how far above or below their respective long-term trend lines (39 week SMA) my currently tracked ETFs are positioned.

This report covers the HV ETF Master List from Thursday’s StatSheet and includes 366 High Volume ETFs ETFs, defined as those with an average daily volume of more than $5 million, of which currently 237 (last week 252) are hovering in bullish territory. The yellow line separates those ETFs that are positioned above their trend line (%M/A) from those that have dropped below it.

Take a look:

The HV ETF Master Cutline Report            

In case you are not familiar with some of the terminology used in the reports, please read the Glossary of Terms.

If you missed the original post about the Cutline approach, you can read it here.