
- Moving the Markets
It was a choppy session with macro data serving another notice that economic conditions are weakening, a theme I have been pounding on for quite some time. Today, things started with disappointing U.S productivity, the key to a high living standard, which declined at an annual pace of 0.6% for the 1st quarter 2017 (far worse than the expected 0.1% decline).
That was followed by another hard data miss, namely factory orders that rose 0.2%, which was half of the expected gain of 0.4%. The core orders (without transportation) looked worse, as they stumbled 0.3% the biggest drop since February 2016.
The third try turned out to be a charm as Obamacare was successfully repealed but faces serious senate bickering, which may lead to a significant rewrite of the legislation.
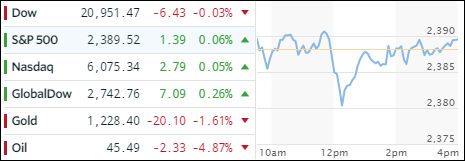
Equities were muted and danced around the unchanged line all day with nothing to show for. The loser of the day award goes to Oil, which was spanked at the tune of -4.87% closing below $46/barrel.
With June rate hike odds still hovering at 90%, it came as no surprise that Treasury yields rose with the 10-year adding 3 basis points to 2.36%, which is quite a jump off the recent 2.18% lows. The US dollar (UUP) slipped and has now clearly broken below its 200-day M/A. While the dollar and the S&P 500 roughly move in sync, that relationship has widened as the chart shows:
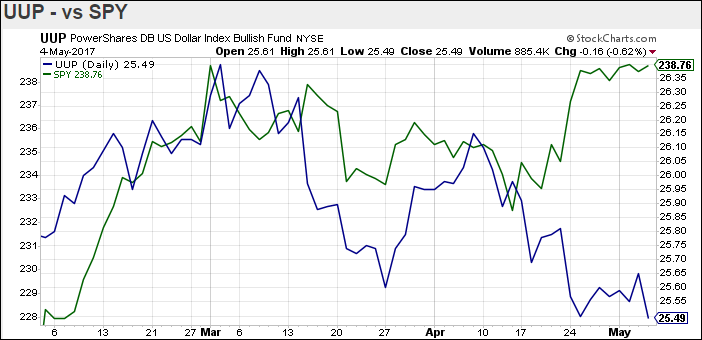
Sooner or later something will have to give: Either the S&P 500 will drop or the US dollar will rally to close the gap.
- ETFs in the Spotlight (updated for 2017)
In case you missed the announcement and description of this section, you can read it here again.
It features 10 broadly diversified and sector ETFs from my HighVolume list as posted every Saturday. Furthermore, they are screened for the lowest MaxDD% number meaning they have been showing better resistance to temporary sell offs than all others over the past year.
The below table simply demonstrates the magnitude with which some of the ETFs are fluctuating in regards to their positions above or below their respective individual trend lines (%M/A). A break below, represented by a negative number, shows weakness, while a break above, represented by a positive percentage, shows strength.
For hundreds of ETF choices, be sure to reference Thursday’s StatSheet.
Year to date, here’s how the 2017 candidates have fared so far:
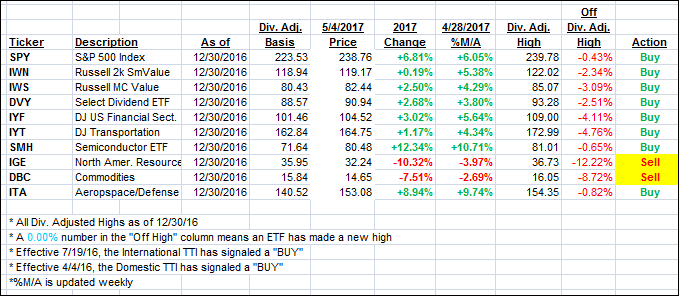
Again, the %M/A column above shows the position of the various ETFs in relation to their respective long term trend lines, while the trailing sell stops are being tracked in the “Off High” column. The “Action” column will signal a “Sell” once the -7.5% point has been taken out in the “Off High” column.
- Trend Tracking Indexes (TTIs)
Our Trend Tracking Indexes (TTIs) closed up with the International one taking a leap deeper into bullish territory as that arena showed more upward momentum than the domestic market.
Here’s how we closed 5/4/2017:
Domestic TTI: +3.41% (last close +3.32%)—Buy signal effective 4/4/2016
International TTI: +8.23% (last close +7.26%)—Buy signal effective 7/19/2016
Disclosure: I am obliged to inform you that I, as well as my advisory clients, own some of the ETFs listed in the above table. Furthermore, they do not represent a specific investment recommendation for you, they merely show which ETFs from the universe I track are falling within the guidelines specified.
Contact Ulli