
- Moving the Markets
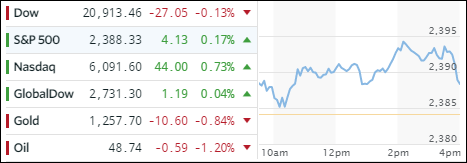
While the Nasdaq and S&P 500 hovered above their respective unchanged lines all day, the Dow see-sawed and dove into the close for a slight loss. The Nasdaq was the savior with a solid +0.73% gain, but it also threw an assist to the S&P thereby helping it to close in the green. However, volume was the lowest of 2017 and 40% below 2016’s May Day volume.
Economic data points for manufacturing and personal income/spending were less than expected contributing to the loss of upward momentum, which dominated market sentiment all of last week.
Caution was the word of the day in the markets as a variety of upcoming events certainly could upset the bullish crowd. Here are some of them:
- Fed decision on interest rates (Wed)
- The April Labor report (Fri)
- The ongoing Debt Ceiling debacle (Fri)
- The second round of the French elections with the run off scheduled for this coming Sunday
- ETFs in the Spotlight (updated for 2017)
In case you missed the announcement and description of this section, you can read it here again.
It features 10 broadly diversified and sector ETFs from my HighVolume list as posted every Saturday. Furthermore, they are screened for the lowest MaxDD% number meaning they have been showing better resistance to temporary sell offs than all others over the past year.
The below table simply demonstrates the magnitude with which some of the ETFs are fluctuating in regards to their positions above or below their respective individual trend lines (%M/A). A break below, represented by a negative number, shows weakness, while a break above, represented by a positive percentage, shows strength.
For hundreds of ETF choices, be sure to reference Thursday’s StatSheet.
Year to date, here’s how the 2017 candidates have fared so far:
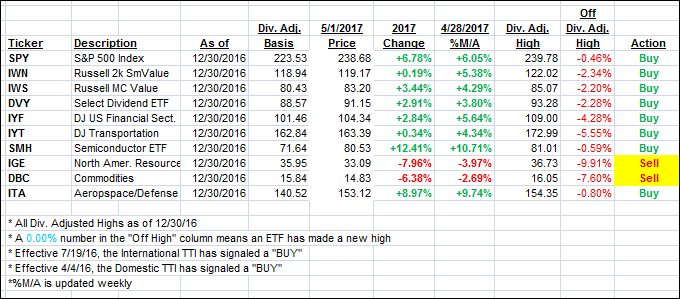
Again, the %M/A column above shows the position of the various ETFs in relation to their respective long term trend lines, while the trailing sell stops are being tracked in the “Off High” column. The “Action” column will signal a “Sell” once the -7.5% point has been taken out in the “Off High” column.
- Trend Tracking Indexes (TTIs)
Our Trend Tracking Indexes (TTIs) edged up a tad as the markets presented a mixed picture.
Here’s how we closed 5/1/2017:
Domestic TTI: +3.30% (last close +3.14%)—Buy signal effective 4/4/2016
International TTI: +7.07% (last close +6.91%)—Buy signal effective 7/19/2016
Disclosure: I am obliged to inform you that I, as well as my advisory clients, own some of the ETFs listed in the above table. Furthermore, they do not represent a specific investment recommendation for you, they merely show which ETFs from the universe I track are falling within the guidelines specified.
Contact Ulli