Weekly StatSheet For The ETF Tracker Newsletter – Updated Through 03/15/2018

Ulli ETF StatSheet Contact

ETF Data updated through Thursday, March 15, 2018

Methodology/Use of this StatSheet:

  1. From the universe of over 1,800 ETFs, I have selected only those with a trading volume of over $5 million per day (HV ETFs), so that liquidity and a small bid/ask spread are assured.
  2. Trend Tracking Indexes (TTIs)

Buy or Sell decisions for Domestic and International ETFs (section 1 and 2), are made based on the respective TTI and its position either above or below its long-term M/A (Moving Average). A crossing of the trend line from below accompanied by some staying power above constitutes a “Buy” signal. Conversely, a clear break below the line constitutes a “Sell” signal. Additionally, I use a 7.5% trailing stop loss on all positions in these categories to control downside risk.

  1. All other investment arenas do not have a TTI and should be traded based on the position of the individual ETF relative to its own respective trend line (%M/A). That’s why those signals are referred to as a “Selective Buy.” In other words, if an ETF crosses its own trendline to the upside, a “Buy” signal is generated. Since these areas tend to be more volatile, I recommend a wider trailing sell stop of 7.5% -10% depending on your risk tolerance.

If you are unfamiliar with some of the terminology, please see Glossary of Terms and new subscriber information in section 9.


  1. DOMESTIC EQUITY ETFs: BUY — since 4/4/2016

Click on chart to enlarge

Our main directional indicator, the Domestic Trend Tracking Index (TTI-green line in the above chart) is positioned above its long-term trend line (red) by +3.43% after having generated a new Domestic Buy signal effective 4/4/2016 as posted.

Read More

Lingering Trade-War Fears Keep Market Jitters Alive

Ulli Market Commentary Contact

[Chart courtesy of MarketWatch.com]
  1. Moving the markets

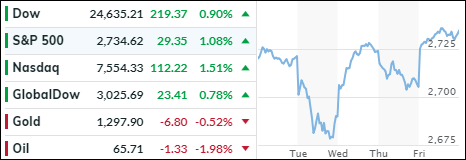
It was a mixed bag with the Dow managing to overcome a 3-day losing streak while the S&P & Nasdaq hovered on both sides of the unchanged line but slipped slightly into the red. The markets are still trying to digest Trump’s comments from yesterday that his administration intends to trim the trade deficit with China to $100 billion (from the current $375 billion).

While some economic data points indicated improving conditions, none of these made an impression on the markets as most of it was already priced in. As a surprise to some analysts, the import price index rose 0.4% in February, after an even higher increase in January, which reflects higher prices we are paying for foreign goods. Let’s wait and see the effects of the trade wars on this index, which is bound to make far larger moves than we’ve seen so far.

Interest rates rose slightly with the 10-year bond yield adding 1 basis point to 2.82%, while the Dollar Index (UUP) jumped higher by +0.38% most likely due to Trump’s new economic advisor, Larry Kudlow, trying to make a name for himself by dispensing the investment advice to “buy the dollar and sell gold.” Yeah, right…

Read More

Igniting Trade-War Worries Punish Markets; GDP Forecast Slammed

Ulli Market Commentary Contact

[Chart courtesy of MarketWatch.com]
  1. Moving the markets

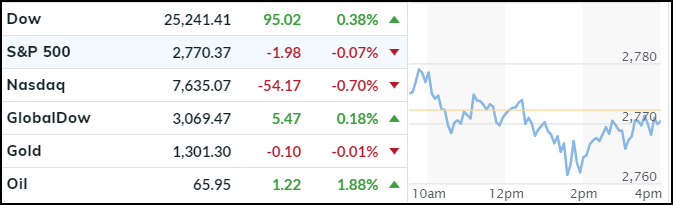
A host of headlines appeared to punish the markets by pushing the major indexes down for the third day in the row. First, there was more jawboning about tough trade talk with China, as the administration announced a $100 billion annual China deficit target from last year’s $375 billion. Of course, retaliation is expected with one of the victims very likely being Boeing, whose stock subsequently got hammered for the second day in a row, which did not bode well for the Dow.

Then there was the matter of the GDP, as the Atlanta Fed (along with Goldman) slashed its forecast from its wild expectations of 5.4% down to a meager and far more realistic 1.9%, in part due to ever weakening retail sales, which had it worst declining streak since 2015. That was enough to take away some of the early bullishness and south we went. Despite a mid-day hiccup, the session was clearly dominated by the bears.

The Producer Price Index (PPI) had wholesale inflation up +0.2% in February (vs. +0.1% expected), but that was down from the 0.4% advance in January.

The VIX rallied above 17 and did its part to keep the markets in check. Interest rates dropped with the 10-year bond yield declining 3 basis points to 2.81%. The US Dollar, which sank for the 3 days in a row, managed to buck its trend by gaining +0.04%.

Overall, there was no news that could have boosted the markets. However, some ETFs in our portfolios withstood the negative sentiment as Semiconductors (SMH +0.05%), International ETFs (SCHF +0.26%) and International SmallCaps (SCHC +0.32%) managed to end this session in the green.

Read More

Early Rally Fades As Bears Score A Win; Gold Pops As Dollar Drops

Ulli Market Commentary Contact

[Chart courtesy of MarketWatch.com]
  1. Moving the markets

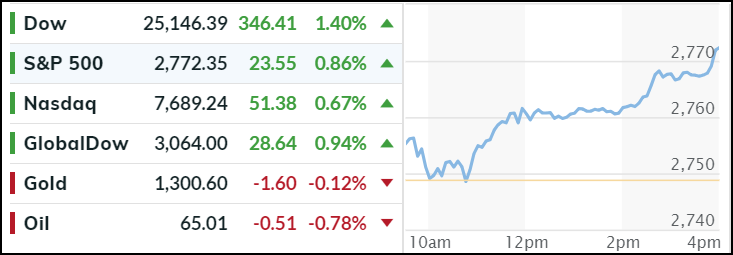
Good thing inflation data was fairly benign, as the CPI rose ‘only’ +0.2% in February, after an alarming increase in January of 0.5%, or the markets might have really taken a dive. As it turned out, the major indexes slid slowly but steadily through the entire session wiping out early gains.

Despite the continuing game of musical chairs in the White House, with the latest departure being Secretary of State Tillerson, Wall Street took the announcement in stride assuming that the latest shuffle would not have any future economic effects or risks.

Technology and financial sectors were the weaklings of the day with the Boeing and Goldman Sachs contributing a loss of some 70 points to the Dow. Tech stocks were on the losing end as the Broadcom/Qualcomm deal died and more jawboning from Washington about tariffs took the starch out of the early rally.

The only safe havens were Gold and bonds, as the 10-year yield dropped 3 basis points to 2.84%, which allowed the 20-year bond (TLT) to rally +0.51%. The US Dollar (UUP) followed its recent pattern by closing down -0.26%, its 3rd straight down day in a row.

Read More

Bulls And Bears Engage In A Tug-Of-War

Ulli Market Commentary Contact

[Chart courtesy of MarketWatch.com]
  1. Moving the markets

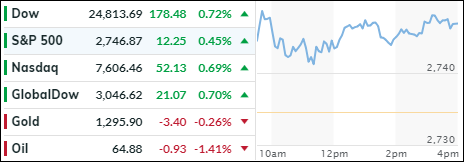
After Friday’s monster rally, and last week’s overall bullish tone in the markets, it comes as no surprise that the major averages might take a pause, and that’s precisely what happened. All three of them vacillated around the unchanged line with the Dow and S&P giving back a fraction while the Nasdaq closed in the green.

There was nothing on the economic calendar to assist the bulls or the bears, so the focus remained on Friday’s jobs report alleviating fears that solid growth might trigger wage pressure due to a tighter labor market. While this has not happened yet does not mean it won’t in the future, but for the time being Wall Street sees this as dampener to an acceleration in future interest rate hikes.

As a result, the 10-year bond yield slipped 3 basis points to 2.87%, however, rates and inflation will be a big risk factor going forward, and it remains to be seen where the bond trigger point will be that will eventually affect equity prices negatively.

Read More

ETFs On The Cutline – Updated Through 03/09/2018

Ulli Uncategorized Contact

Below please find the latest High Volume ETFs Cutline report, which shows how far above or below their respective long-term trend lines (39 week SMA) my currently tracked ETFs are positioned.

This report covers the HV ETF Master List from Thursday’s StatSheet and includes 366 High Volume ETFs ETFs, defined as those with an average daily volume of more than $5 million, of which currently 221 (last week 185) are hovering in bullish territory. The yellow line separates those ETFs that are positioned above their trend line (%M/A) from those that have dropped below it.

Take a look:

The HV ETF Master Cutline Report

In case you are not familiar with some of the terminology used in the reports, please read the Glossary of Terms.

If you missed the original post about the Cutline approach, you can read it here.