
- Moving the markets
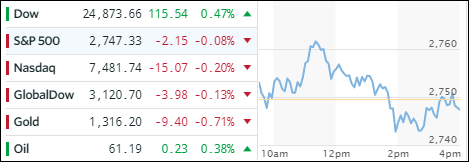
It was a mixed bag with the Dow managing to overcome a 3-day losing streak while the S&P & Nasdaq hovered on both sides of the unchanged line but slipped slightly into the red. The markets are still trying to digest Trump’s comments from yesterday that his administration intends to trim the trade deficit with China to $100 billion (from the current $375 billion).
While some economic data points indicated improving conditions, none of these made an impression on the markets as most of it was already priced in. As a surprise to some analysts, the import price index rose 0.4% in February, after an even higher increase in January, which reflects higher prices we are paying for foreign goods. Let’s wait and see the effects of the trade wars on this index, which is bound to make far larger moves than we’ve seen so far.
Interest rates rose slightly with the 10-year bond yield adding 1 basis point to 2.82%, while the Dollar Index (UUP) jumped higher by +0.38% most likely due to Trump’s new economic advisor, Larry Kudlow, trying to make a name for himself by dispensing the investment advice to “buy the dollar and sell gold.” Yeah, right…
- ETFs in the Spotlight
In case you missed the announcement and description of this section, you can read it here again.
It features 10 broadly diversified and sector ETFs from my HighVolume list as posted every Saturday. Furthermore, they are screened for the lowest MaxDD% number meaning they have been showing better resistance to temporary sell offs than all others over the past year.
The below table simply demonstrates the magnitude with which some of the ETFs are fluctuating in regards to their positions above or below their respective individual trend lines (%M/A). A break below, represented by a negative number, shows weakness, while a break above, represented by a positive percentage, shows strength.
For hundreds of ETF choices, be sure to reference Thursday’s StatSheet.
Year to date, here’s how our candidates have fared so far:
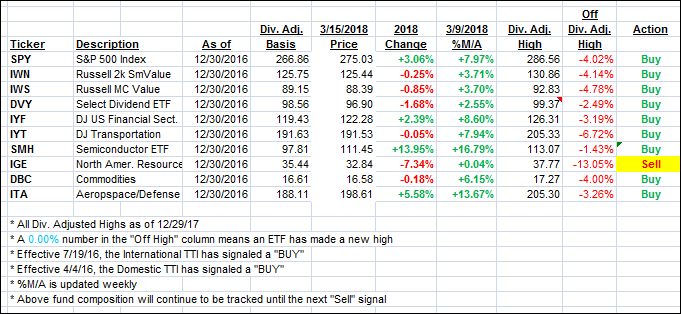
Again, the %M/A column above shows the position of the various ETFs in relation to their respective long term trend lines, while the trailing sell stops are being tracked in the “Off High” column. The “Action” column will signal a “Sell” once the -7.5% point has been taken out in the “Off High” column.
- Trend Tracking Indexes (TTIs)
Our Trend Tracking Indexes (TTIs) barely changed as markets were range bound.
Here’s how we closed 3/15/2018:
Domestic TTI: +3.43% above its M/A (last close +3.53%)—Buy signal effective 4/4/2016
International TTI: +3.57% above its M/A (last close +3.61%)—Buy signal effective 7/19/2016
Disclosure: I am obliged to inform you that I, as well as my advisory clients, own some of the ETFs listed in the above table. Furthermore, they do not represent a specific investment recommendation for you, they merely show which ETFs from the universe I track are falling within the guidelines specified.
Contact Ulli