
- Moving the markets
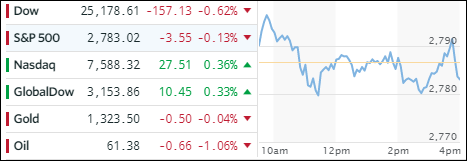
After Friday’s monster rally, and last week’s overall bullish tone in the markets, it comes as no surprise that the major averages might take a pause, and that’s precisely what happened. All three of them vacillated around the unchanged line with the Dow and S&P giving back a fraction while the Nasdaq closed in the green.
There was nothing on the economic calendar to assist the bulls or the bears, so the focus remained on Friday’s jobs report alleviating fears that solid growth might trigger wage pressure due to a tighter labor market. While this has not happened yet does not mean it won’t in the future, but for the time being Wall Street sees this as dampener to an acceleration in future interest rate hikes.
As a result, the 10-year bond yield slipped 3 basis points to 2.87%, however, rates and inflation will be a big risk factor going forward, and it remains to be seen where the bond trigger point will be that will eventually affect equity prices negatively.
- ETFs in the Spotlight
In case you missed the announcement and description of this section, you can read it here again.
It features 10 broadly diversified and sector ETFs from my HighVolume list as posted every Saturday. Furthermore, they are screened for the lowest MaxDD% number meaning they have been showing better resistance to temporary sell offs than all others over the past year.
The below table simply demonstrates the magnitude with which some of the ETFs are fluctuating in regards to their positions above or below their respective individual trend lines (%M/A). A break below, represented by a negative number, shows weakness, while a break above, represented by a positive percentage, shows strength.
For hundreds of ETF choices, be sure to reference Thursday’s StatSheet.
Year to date, here’s how our candidates have fared so far:
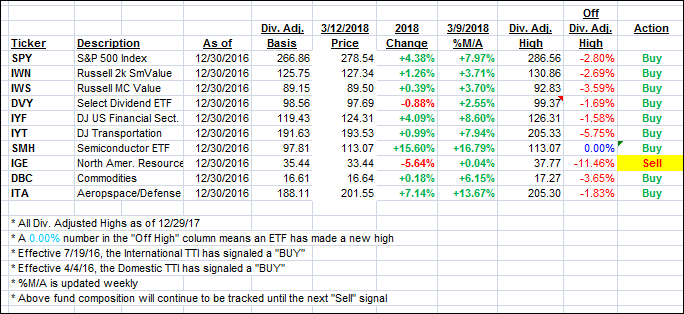
Again, the %M/A column above shows the position of the various ETFs in relation to their respective long term trend lines, while the trailing sell stops are being tracked in the “Off High” column. The “Action” column will signal a “Sell” once the -7.5% point has been taken out in the “Off High” column.
- Trend Tracking Indexes (TTIs)
Our Trend Tracking Indexes (TTIs) barely moved as the major indexes lacked clear direction.
Here’s how we closed 3/12/2018:
Domestic TTI: +3.98% above its M/A (last close +3.98%)—Buy signal effective 4/4/2016
International TTI: +4.25% above its M/A (last close +4.06%)—Buy signal effective 7/19/2016
Disclosure: I am obliged to inform you that I, as well as my advisory clients, own some of the ETFs listed in the above table. Furthermore, they do not represent a specific investment recommendation for you, they merely show which ETFs from the universe I track are falling within the guidelines specified.
Contact Ulli