
- Moving the markets
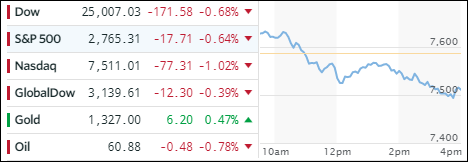
Good thing inflation data was fairly benign, as the CPI rose ‘only’ +0.2% in February, after an alarming increase in January of 0.5%, or the markets might have really taken a dive. As it turned out, the major indexes slid slowly but steadily through the entire session wiping out early gains.
Despite the continuing game of musical chairs in the White House, with the latest departure being Secretary of State Tillerson, Wall Street took the announcement in stride assuming that the latest shuffle would not have any future economic effects or risks.
Technology and financial sectors were the weaklings of the day with the Boeing and Goldman Sachs contributing a loss of some 70 points to the Dow. Tech stocks were on the losing end as the Broadcom/Qualcomm deal died and more jawboning from Washington about tariffs took the starch out of the early rally.
The only safe havens were Gold and bonds, as the 10-year yield dropped 3 basis points to 2.84%, which allowed the 20-year bond (TLT) to rally +0.51%. The US Dollar (UUP) followed its recent pattern by closing down -0.26%, its 3rd straight down day in a row.
- ETFs in the Spotlight
In case you missed the announcement and description of this section, you can read it here again.
It features 10 broadly diversified and sector ETFs from my HighVolume list as posted every Saturday. Furthermore, they are screened for the lowest MaxDD% number meaning they have been showing better resistance to temporary sell offs than all others over the past year.
The below table simply demonstrates the magnitude with which some of the ETFs are fluctuating in regards to their positions above or below their respective individual trend lines (%M/A). A break below, represented by a negative number, shows weakness, while a break above, represented by a positive percentage, shows strength.
For hundreds of ETF choices, be sure to reference Thursday’s StatSheet.
Year to date, here’s how our candidates have fared so far:
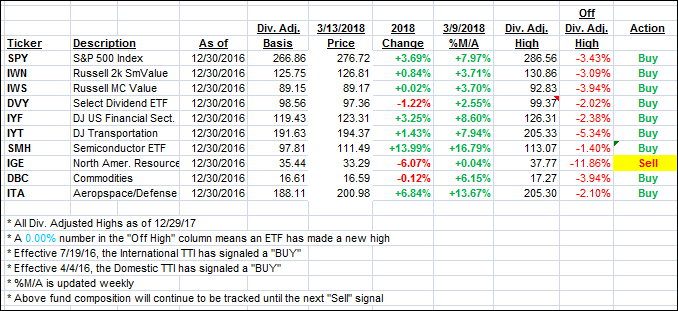
Again, the %M/A column above shows the position of the various ETFs in relation to their respective long term trend lines, while the trailing sell stops are being tracked in the “Off High” column. The “Action” column will signal a “Sell” once the -7.5% point has been taken out in the “Off High” column.
- Trend Tracking Indexes (TTIs)
Our Trend Tracking Indexes (TTIs) headed south as market weakness prevailed throughout the session.
Here’s how we closed 3/13/2018:
Domestic TTI: +3.69% above its M/A (last close +3.98%)—Buy signal effective 4/4/2016
International TTI: +3.76% above its M/A (last close +4.25%)—Buy signal effective 7/19/2016
Disclosure: I am obliged to inform you that I, as well as my advisory clients, own some of the ETFs listed in the above table. Furthermore, they do not represent a specific investment recommendation for you, they merely show which ETFs from the universe I track are falling within the guidelines specified.
Contact Ulli