Trade Wars: Optimism Gives Way To Pessimism; Major Indexes Sink

Ulli Market Commentary Contact

[Chart courtesy of MarketWatch.com]
  1. Moving the markets

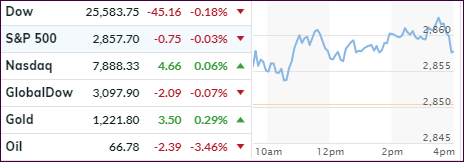
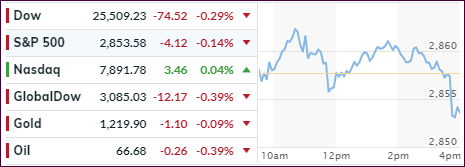
Yesterday’s rally, which was entirely powered by hope for a U.S./China trade resolution, came under pressure today, after an early follow through ramp petered out in the afternoon with the major indexes heading straight south into the red scoring modest losses.

Pessimism replaced optimism as uncertainties over trade policy and geopolitical issues took center stage. Responding to reporters if he was happy with the current state of the trade talks, President Trump responded with “not really” and that negotiations “have a long way to go.” Not exactly the kind of ‘progress’ report markets had expected, and down we went.

Adding fuel to the fire were reports that in regards to the upcoming historical meeting between Trump and N. Korea’s Kim Jong Un, Trump said that such a meeting may happen later than currently scheduled. That was followed White House headlines that any new nuclear deal with Iran would be subject to a list of demands.

None of these developments were soothing to Wall Street traders, who adopted a wait-and-see attitude. All of the above mentioned events really don’t have any major direct economic impact, but are more of a psychological nature causing uncertainty and keeping markets stuck in a broad range.

Read More

Easing Trade War Fears Power Markets

Ulli Market Commentary Contact

[Chart courtesy of MarketWatch.com]
  1. Moving the markets

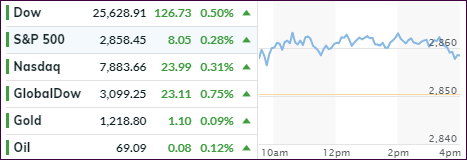
Right after the opening bell, the major indexes jumped and remained firmly entrenched above the unchanged line for the entire session gaining solidly across the board.

Causing this euphoria was hope that the U.S./China trade animosities and rhetoric finally softened after weekend news that the Trump administration would delay implementation of tariffs on Chinese goods. In other words, they agreed to put the current hostilities on hold until a new deal can be worked out.

That’s all it took and off to the races we went without looking back. Actually, there were a lot of uncertainties to be concerned with. If you followed the weekend news, you noticed that Emerging Markets are still in stumble mode, which started back in February with lower lows being interrupted by periodic bounces.

Then there were the Italian financial markets, which are imploding due to sharply spiking rates while domestic bond yields and the U.S dollar were stuck and going nowhere. Italy took the headlines in Europe with one analyst proclaiming that “the Italian 2-year yield has given back 3 years of monetary suppression in 6 trading days.” How bad was it? This chart makes it abundantly clear while I am pondering the question if this could be the canary in the coalmine.

But none of this mattered today, as the main objective was to push the Dow back above 25k, which was accomplished with the help of not letting an early VIX rally (translates into lower stock prices) get out of hand.

Read More

ETFs On The Cutline – Updated Through 05/18/2018

Ulli ETFs on the Cutline Contact

Below please find the latest High Volume ETFs Cutline report, which shows how far above or below their respective long-term trend lines (39 week SMA) my currently tracked ETFs are positioned.

This report covers the HV ETF Master List from Thursday’s StatSheet and includes 366 High Volume ETFs ETFs, defined as those with an average daily volume of more than $5 million, of which currently 185 (last week 199) are hovering in bullish territory. The yellow line separates those ETFs that are positioned above their trend line (%M/A) from those that have dropped below it.

Take a look:

The HV ETF Master Cutline Report

In case you are not familiar with some of the terminology used in the reports, please read the Glossary of Terms.

If you missed the original post about the Cutline approach, you can read it here.

ETF Tracker Newsletter For May 18, 2018

Ulli ETF Tracker Contact

ETF Tracker StatSheet

https://theetfbully.com/2018/05/weekly-statsheet-for-the-etf-tracker-newsletter-updated-through-05-17-2018/

 MAJOR INDEXES RETREAT FOR THE WEEK

[Chart courtesy of MarketWatch.com]
  1. Moving the markets

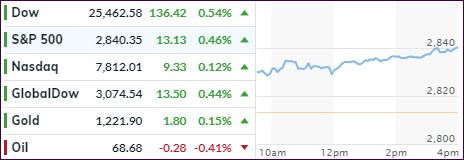
The primary direction for the major indexes this week was sideways to down. The Dow and S&P gave back -0.5%, their third weekly declines of the past four, while the Nasdaq sank -0.7%.

The more dramatic action happened in Italy and the Emerging Markets (EMs) with Italian stocks, bonds, banks and credit all dumping this week. While EM’s foreign exchange and debt collapsed, their stocks declined more modestly putting our EEM holding within striking distance of triggering its trailing sell stop.

Bucking the trend again were SmallCaps by rising +0.1% today to a third straight record close and third positive week, which was its longest streak since January.

Trade talks with China took a spin for the worse creating more anxiety and nervousness among traders as “progress” was a word nowhere to be uttered neither by the U.S. nor China. Alleged offers made by China on Thursday were promptly denied on Friday.

Even a small assist from sliding 10-year bond yields, which early on made an intra-day of 3.11%, but in the end gave back 5 basis points to close at 3.06%, did nothing to prop up equities.

So, we end this week still stuck in a sideways pattern and wondering if climbing bond yields will bring an end to this bullish run, or if a new driver emerges to push this market out of the doldrums.

Read More

Weekly StatSheet For The ETF Tracker Newsletter – Updated Through 05/17/2018

Ulli ETF StatSheet Contact

ETF Data updated through Thursday, May 17, 2018

Methodology/Use of this StatSheet:

From the universe of over 1,800 ETFs, I have selected only those with a trading volume of over $5 million per day (HV ETFs), so that liquidity and a small bid/ask spread are assured.

1. Trend Tracking Indexes (TTIs)

Buy or Sell decisions for Domestic and International ETFs (section 1 and 2), are made based on the respective TTI and its position either above or below its long-term M/A (Moving Average). A crossing of the trend line from below accompanied by some staying power above constitutes a “Buy” signal. Conversely, a clear break below the line constitutes a “Sell” signal. Additionally, I use a 7.5% trailing stop loss on all positions in these categories to control downside risk.

2.  All other investment arenas do not have a TTI and should be traded based on the position of the individual ETF relative to its own respective trend line (%M/A). That’s why those signals are referred to as a “Selective Buy.” In other words, if an ETF crosses its own trendline to the upside, a “Buy” signal is generated. Since these areas tend to be more volatile, I recommend a wider trailing sell stop of 7.5% -10% depending on your risk tolerance.

If you are unfamiliar with some of the terminology, please see Glossary of Terms and new subscriber information in section 9.


  1. DOMESTIC EQUITY ETFs: BUY — since 4/4/2016

Click on chart to enlarge

Our main directional indicator, the Domestic Trend Tracking Index (TTI-green line in the above chart) is positioned above its long-term trend line (red) by +1.99% after having generated a new Domestic Buy signal effective 4/4/2016 as posted.

Read More

Rising Bond Yields Keep Markets In Check

Ulli Market Commentary Contact

[Chart courtesy of MarketWatch.com]
  1. Moving the markets

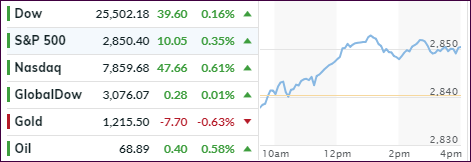
An early rally lost steam with the major indexes heading south and closing slightly in the red. It was mixed picture as weakness in the tech arena could not be offset by advancing energy shares and continued strength in SmallCaps (+0.48%).

Rising bond yields affected the defensive sectors like utilities (-0.9%) and real estate (-0.5%), which were heading south on a slippery slope. Today was no exception, as the 10-year bond yield kept crawling higher and added 2 basis points to close at 3.11%—nearly a 7-year high.

As I mentioned yesterday, climbing yields can only be ignored for so long before they take a bite out of equity gains. Not helping matters were President Trump’s comments about the ongoing U.S./China trade talks, currently held in Washington, when he said that expectations for the negotiations were low.

In the end, none of the events of the day were conducive to produce the bullish case for equities. Higher bond yields will simply remain the elephant in the room for equities, which means they present a glass ceiling that will be hard to crack.

Read More