
- Moving the markets
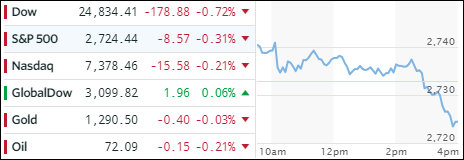
Yesterday’s rally, which was entirely powered by hope for a U.S./China trade resolution, came under pressure today, after an early follow through ramp petered out in the afternoon with the major indexes heading straight south into the red scoring modest losses.
Pessimism replaced optimism as uncertainties over trade policy and geopolitical issues took center stage. Responding to reporters if he was happy with the current state of the trade talks, President Trump responded with “not really” and that negotiations “have a long way to go.” Not exactly the kind of ‘progress’ report markets had expected, and down we went.
Adding fuel to the fire were reports that in regards to the upcoming historical meeting between Trump and N. Korea’s Kim Jong Un, Trump said that such a meeting may happen later than currently scheduled. That was followed White House headlines that any new nuclear deal with Iran would be subject to a list of demands.
None of these developments were soothing to Wall Street traders, who adopted a wait-and-see attitude. All of the above mentioned events really don’t have any major direct economic impact, but are more of a psychological nature causing uncertainty and keeping markets stuck in a broad range.
- ETFs in the Spotlight
In case you missed the announcement and description of this section, you can read it here again.
It features 10 broadly diversified and sector ETFs from my HighVolume list as posted every Saturday. Furthermore, they are screened for the lowest MaxDD% number meaning they have been showing better resistance to temporary sell offs than all others over the past year.
The below table simply demonstrates the magnitude with which some of the ETFs are fluctuating in regards to their positions above or below their respective individual trend lines (%M/A). A break below, represented by a negative number, shows weakness, while a break above, represented by a positive percentage, shows strength.
For hundreds of ETF choices, be sure to reference Thursday’s StatSheet.
Year to date, here’s how our candidates have fared so far:
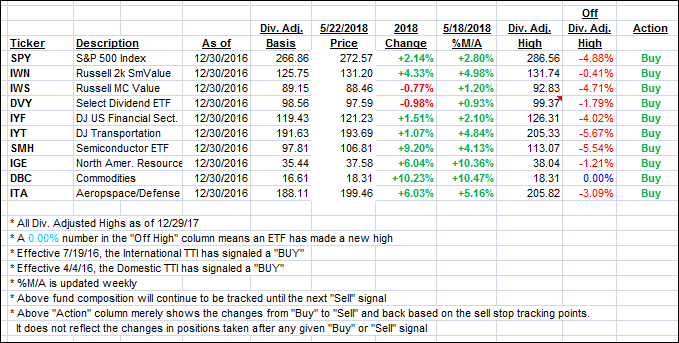
Again, the %M/A column above shows the position of the various ETFs in relation to their respective long term trend lines, while the trailing sell stops are being tracked in the “Off High” column. The “Action” column will signal a “Sell” once the -7.5% point has been taken out in the “Off High” column.
- Trend Tracking Indexes (TTIs)
Our Trend Tracking Indexes (TTIs) were mixed with the Domestic one slipping and the International one gaining a tad.
Here’s how we closed 05/22/2018:
Domestic TTI: +1.85% above its M/A (last close +2.08%)—Buy signal effective 4/4/2016
International TTI: +2.66% below its M/A (last close +2.64%)—Buy signal effective 7/19/2016
Disclosure: I am obliged to inform you that I, as well as my advisory clients, own some of the ETFs listed in the above table. Furthermore, they do not represent a specific investment recommendation for you, they merely show which ETFs from the universe I track are falling within the guidelines specified.
Contact Ulli