
ETF Tracker StatSheet
MAJOR INDEXES RETREAT FOR THE WEEK
- Moving the markets
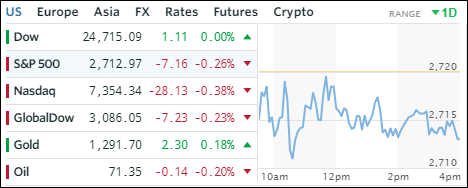
The primary direction for the major indexes this week was sideways to down. The Dow and S&P gave back -0.5%, their third weekly declines of the past four, while the Nasdaq sank -0.7%.
The more dramatic action happened in Italy and the Emerging Markets (EMs) with Italian stocks, bonds, banks and credit all dumping this week. While EM’s foreign exchange and debt collapsed, their stocks declined more modestly putting our EEM holding within striking distance of triggering its trailing sell stop.
Bucking the trend again were SmallCaps by rising +0.1% today to a third straight record close and third positive week, which was its longest streak since January.
Trade talks with China took a spin for the worse creating more anxiety and nervousness among traders as “progress” was a word nowhere to be uttered neither by the U.S. nor China. Alleged offers made by China on Thursday were promptly denied on Friday.
Even a small assist from sliding 10-year bond yields, which early on made an intra-day of 3.11%, but in the end gave back 5 basis points to close at 3.06%, did nothing to prop up equities.
So, we end this week still stuck in a sideways pattern and wondering if climbing bond yields will bring an end to this bullish run, or if a new driver emerges to push this market out of the doldrums.
- ETFs in the Spotlight
In case you missed the announcement and description of this section, you can read it here again.
It features 10 broadly diversified and sector ETFs from my HighVolume list as posted every Saturday. Furthermore, they are screened for the lowest MaxDD% number meaning they have been showing better resistance to temporary sell offs than all others over the past year.
The below table simply demonstrates the magnitude with which some of the ETFs are fluctuating in regards to their positions above or below their respective individual trend lines (%M/A). A break below, represented by a negative number, shows weakness, while a break above, represented by a positive percentage, shows strength.
For hundreds of ETF choices, be sure to reference Thursday’s StatSheet.
Year to date, here’s how our candidates have fared so far:
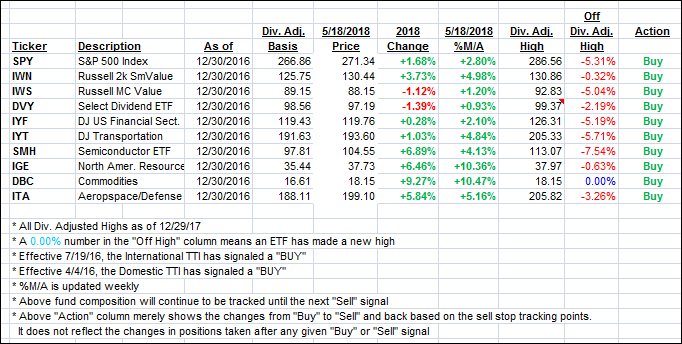
Again, the %M/A column above shows the position of the various ETFs in relation to their respective long term trend lines, while the trailing sell stops are being tracked in the “Off High” column. The “Action” column will signal a “Sell” once the -7.5% point has been taken out in the “Off High” column.
- Trend Tracking Indexes (TTIs)
Our Trend Tracking Indexes (TTIs) slipped along as weakness was prevalent among most markets.
Here’s how we closed 05/18/2018:
Domestic TTI: +1.81% above its M/A (last close +1.99%)—Buy signal effective 4/4/2016
International TTI: +2.25% below its M/A (last close +2.71%)—Buy signal effective 7/19/2016
Disclosure: I am obliged to inform you that I, as well as my advisory clients, own some of the ETFs listed in the above table. Furthermore, they do not represent a specific investment recommendation for you, they merely show which ETFs from the universe I track are falling within the guidelines specified.
————————————————————-
READER Q & As
All Reader Q & A’s are listed at our web site!
Check it out at:
https://theetfbully.com/questions-answers/
———————————————————-
WOULD YOU LIKE TO HAVE YOUR INVESTMENTS PROFESSIONALLY MANAGED?
Do you have the time to follow our investment plans yourself? If you are a busy professional who would like to have his portfolio managed using our methodology, please contact me directly or get more details at:
https://theetfbully.com/personal-investment-management/
———————————————————
Back issues of the ETF/No Load Fund Tracker are available on the web at:
https://theetfbully.com/newsletter-archives/
Contact Ulli