
- Moving the markets
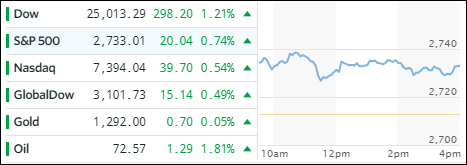
Right after the opening bell, the major indexes jumped and remained firmly entrenched above the unchanged line for the entire session gaining solidly across the board.
Causing this euphoria was hope that the U.S./China trade animosities and rhetoric finally softened after weekend news that the Trump administration would delay implementation of tariffs on Chinese goods. In other words, they agreed to put the current hostilities on hold until a new deal can be worked out.
That’s all it took and off to the races we went without looking back. Actually, there were a lot of uncertainties to be concerned with. If you followed the weekend news, you noticed that Emerging Markets are still in stumble mode, which started back in February with lower lows being interrupted by periodic bounces.
Then there were the Italian financial markets, which are imploding due to sharply spiking rates while domestic bond yields and the U.S dollar were stuck and going nowhere. Italy took the headlines in Europe with one analyst proclaiming that “the Italian 2-year yield has given back 3 years of monetary suppression in 6 trading days.” How bad was it? This chart makes it abundantly clear while I am pondering the question if this could be the canary in the coalmine.
But none of this mattered today, as the main objective was to push the Dow back above 25k, which was accomplished with the help of not letting an early VIX rally (translates into lower stock prices) get out of hand.
- ETFs in the Spotlight
In case you missed the announcement and description of this section, you can read it here again.
It features 10 broadly diversified and sector ETFs from my HighVolume list as posted every Saturday. Furthermore, they are screened for the lowest MaxDD% number meaning they have been showing better resistance to temporary sell offs than all others over the past year.
The below table simply demonstrates the magnitude with which some of the ETFs are fluctuating in regards to their positions above or below their respective individual trend lines (%M/A). A break below, represented by a negative number, shows weakness, while a break above, represented by a positive percentage, shows strength.
For hundreds of ETF choices, be sure to reference Thursday’s StatSheet.
Year to date, here’s how our candidates have fared so far:
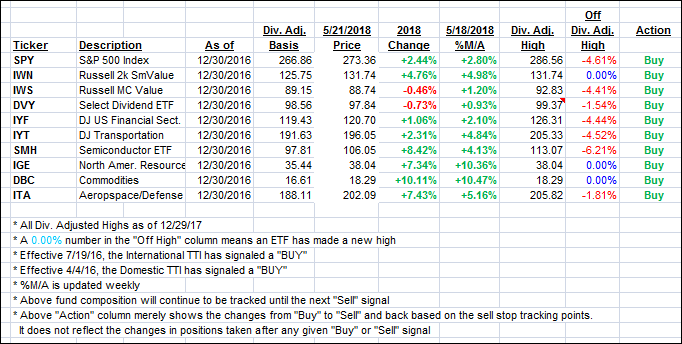
Again, the %M/A column above shows the position of the various ETFs in relation to their respective long term trend lines, while the trailing sell stops are being tracked in the “Off High” column. The “Action” column will signal a “Sell” once the -7.5% point has been taken out in the “Off High” column.
- Trend Tracking Indexes (TTIs)
Our Trend Tracking Indexes (TTIs) bounced as the bulls were clearly in charge.
Here’s how we closed 05/21/2018:
Domestic TTI: +2.08% above its M/A (last close +1.81%)—Buy signal effective 4/4/2016
International TTI: +2.64% below its M/A (last close +2.25%)—Buy signal effective 7/19/2016
Disclosure: I am obliged to inform you that I, as well as my advisory clients, own some of the ETFs listed in the above table. Furthermore, they do not represent a specific investment recommendation for you, they merely show which ETFs from the universe I track are falling within the guidelines specified.
Contact Ulli