Poor Economic Data—Markets Rally

Ulli Market Commentary Contact

[Chart courtesy of MarketWatch.com]
  1. Moving the markets

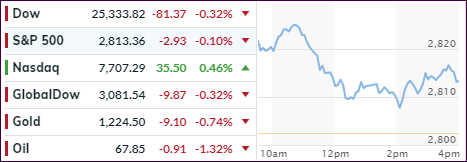
When weak data points appear, one way to deal with them is to simply ignore them. That’s what traders did today, as Housing Starts and Permits tumbled in April (-3.7% MoM and -1.78% MoM respectively), although March permits were revised upwards from +1.9% Mom to 3.6% MoM).

This was followed by a plunge of ReFi applications to 10 year lows, thanks to the Fed’s recent rate hikes and the subsequent spike in mortgage rates.

However, these economic data dumps did nothing other than to push the broad markets higher and to also send SmallCaps (Russell 2000) to a record high. The US Macro Surprise Index confirmed that US economic data are the weakest and most disappointing in 7 months (hat tip to ZH for these numbers).

While Treasury bond yields traded in a narrow range, the trend was up with the 10-year yield rising 1 basis point to close at 3.09%. Overcoming these headwinds was a challenge that traders managed to handle well, at least for today, by keeping the bullish theme alive. However, should the bond yield spike continue unabated, we will run into a scenario that will simply be no longer sustainable for the bullish cause.

Read More

Spiking Bond Yields Equals Sinking Equities

Ulli Market Commentary Contact

[Chart courtesy of MarketWatch.com]
  1. Moving the markets

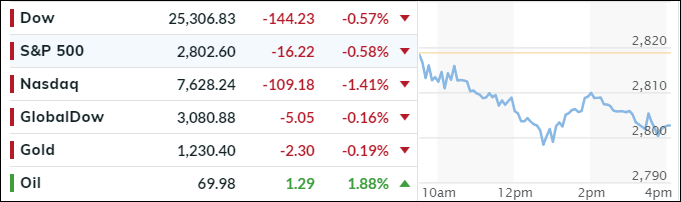
It all started with an April slowdown in retail sales from a revised higher (+0.8%) March number to a lame +0.3% in April indicating a lack of follow through growth. That sent equities lower right after the opening to a level at which the indexes vacillated till closing with the Dow and Transports dipping into the red YTD.

The VIX had its own wild ride by dropping early to the 12 handle only to rebound sharply to touch the 15 number, a rally that kept the indexes pinned below their respective unchanged lines. Remember, a rising VIX causes lower stock prices and vice versa.

But the bloodbath occurred in Treasury Bonds with the yield on the 10-year spiking 8 basis points to an intra-day high of 3.09% but settling at 3.08%, it’s highest since 2011 and its largest single-day jump since March. That punished bond prices with the 20-year (TLT) gapping down and losing -1.14%.

This jump in yield came among continued worries about the uncertainty caused by the deadlock of trade negotiations between the U.S. and China. The fear remains that a clash, or no resolution, may push prices and inflation higher affecting bonds negatively.

It now remains to be seen if the recent channel breakout of the S&P was head fake, which I believe could be true, especially if interest rates continue their path higher. If they retreat, we might see a resumption of the recent trend line bounce.

Read More

Barely Hanging On

Ulli Market Commentary Contact

[Chart courtesy of MarketWatch.com]
  1. Moving the markets

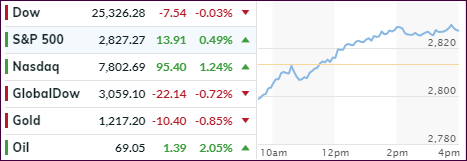
Despite the Dow sporting an 8-day winning streak, an early rally fizzled into the close with the major indexes barely hanging on above their respective unchanged lines. The gains were modest with the leader being energy and health care, while real estate, telecommunications and industrials lagged.

Today’s rally was supported by the perception that trade issues with China may be resolved as new talks are scheduled for this week. President Trump was working with the Chinese Premier to find a solution to keep the Chinese telecom giant ZTE from going out of business as a result of previous sanctions. I guess Wall Street sees the possibility of improved relations when “one hand washes the other.”

While optimism over the recent earnings season reigns supreme, the fly in the ointment continues to be higher interest rates with the 10-year bond yield rising again and closing at the psychologically important 3% level. Last time this occurred (middle of April), the S&P 500 took a 100 point dive. It’ll be interesting to see if this glass ceiling holds again or if equities can overcome this resistance point and rally higher.

Read More

ETFs On The Cutline – Updated Through 05/11/2018

Ulli ETFs on the Cutline Contact

Below please find the latest High Volume ETFs Cutline report, which shows how far above or below their respective long-term trend lines (39 week SMA) my currently tracked ETFs are positioned.

This report covers the HV ETF Master List from Thursday’s StatSheet and includes 366 High Volume ETFs ETFs, defined as those with an average daily volume of more than $5 million, of which currently 199 (last week 173) are hovering in bullish territory. The yellow line separates those ETFs that are positioned above their trend line (%M/A) from those that have dropped below it.

Take a look:

The HV ETF Master Cutline Report

In case you are not familiar with some of the terminology used in the reports, please read the Glossary of Terms.

If you missed the original post about the Cutline approach, you can read it here.

ETF Tracker Newsletter For May 11, 2018

Ulli ETF Tracker Contact

ETF Tracker StatSheet

https://theetfbully.com/2018/05/weekly-statsheet-for-the-etf-tracker-newsletter-updated-through-05-10-2018/

 COMEBACK KID

[Chart courtesy of MarketWatch.com]
  1. Moving the markets

After slumping last week, and threatening to break our long-term trend lines to the downside into bearish territory, this week was just the opposite with the major indexes staging a comeback with each of them gaining over 2%. While we saw some jumpiness today, the Dow and S&P managed to close in the green.

Despite some negative news headlines, none of them were strong enough to spoil the party. Even Trump’s proposed major healthcare changes pulled the indexes down only temporarily before a rebound into the close started.

Overall, the mood was upbeat as Wall Street reflected on solid earnings reports along with slipping bond yields with the 10-year being able to remain below the critical 3% level (2.97%), which seems to be the line in the sand for the bulls and the bears.

Another assist came from the US dollar, which has been on a slippery slope lately. Both of these factors can generate a lot of headwind for equities as rising rates and a strong dollar will make US products harder to sell for those companies doing business abroad.

Our Trend Tracking Indexes (TTIs) are out of the danger zone with both of them having safely moved away from a point that signals a potential break into bearish territory (section 3). That is, at least for the time being.

Read More

Weekly StatSheet For The ETF Tracker Newsletter – Updated Through 05/10/2018

Ulli ETF StatSheet Contact

ETF Data updated through Thursday, May 10, 2018

Methodology/Use of this StatSheet:

  1. From the universe of over 1,800 ETFs, I have selected only those with a trading volume of over $5 million per day (HV ETFs), so that liquidity and a small bid/ask spread are assured.
  2. Trend Tracking Indexes (TTIs)

Buy or Sell decisions for Domestic and International ETFs (section 1 and 2), are made based on the respective TTI and its position either above or below its long-term M/A (Moving Average). A crossing of the trend line from below accompanied by some staying power above constitutes a “Buy” signal. Conversely, a clear break below the line constitutes a “Sell” signal. Additionally, I use a 7.5% trailing stop loss on all positions in these categories to control downside risk.

  1. All other investment arenas do not have a TTI and should be traded based on the position of the individual ETF relative to its own respective trend line (%M/A). That’s why those signals are referred to as a “Selective Buy.” In other words, if an ETF crosses its own trendline to the upside, a “Buy” signal is generated. Since these areas tend to be more volatile, I recommend a wider trailing sell stop of 7.5% -10% depending on your risk tolerance.

If you are unfamiliar with some of the terminology, please see Glossary of Terms and new subscriber information in section 9.


  1. DOMESTIC EQUITY ETFs: BUY — since 4/4/2016
Click on chart to enlarge

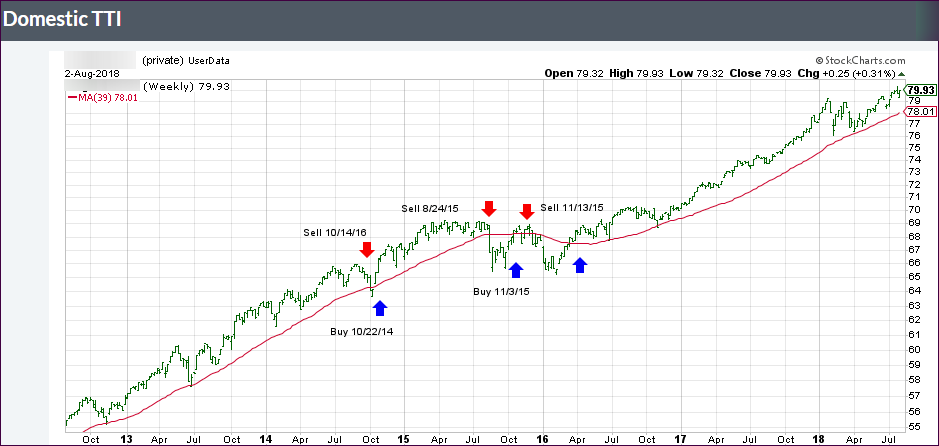
Our main directional indicator, the Domestic Trend Tracking Index (TTI-green line in the above chart) is positioned above its long-term trend line (red) by +2.16% after having generated a new Domestic Buy signal effective 4/4/2016 as posted.
Read More