
- Moving the markets
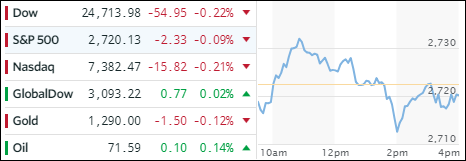
An early rally lost steam with the major indexes heading south and closing slightly in the red. It was mixed picture as weakness in the tech arena could not be offset by advancing energy shares and continued strength in SmallCaps (+0.48%).
Rising bond yields affected the defensive sectors like utilities (-0.9%) and real estate (-0.5%), which were heading south on a slippery slope. Today was no exception, as the 10-year bond yield kept crawling higher and added 2 basis points to close at 3.11%—nearly a 7-year high.
As I mentioned yesterday, climbing yields can only be ignored for so long before they take a bite out of equity gains. Not helping matters were President Trump’s comments about the ongoing U.S./China trade talks, currently held in Washington, when he said that expectations for the negotiations were low.
In the end, none of the events of the day were conducive to produce the bullish case for equities. Higher bond yields will simply remain the elephant in the room for equities, which means they present a glass ceiling that will be hard to crack.
- ETFs in the Spotlight
In case you missed the announcement and description of this section, you can read it here again.
It features 10 broadly diversified and sector ETFs from my HighVolume list as posted every Saturday. Furthermore, they are screened for the lowest MaxDD% number meaning they have been showing better resistance to temporary sell offs than all others over the past year.
The below table simply demonstrates the magnitude with which some of the ETFs are fluctuating in regards to their positions above or below their respective individual trend lines (%M/A). A break below, represented by a negative number, shows weakness, while a break above, represented by a positive percentage, shows strength.
For hundreds of ETF choices, be sure to reference Thursday’s StatSheet.
Year to date, here’s how our candidates have fared so far:
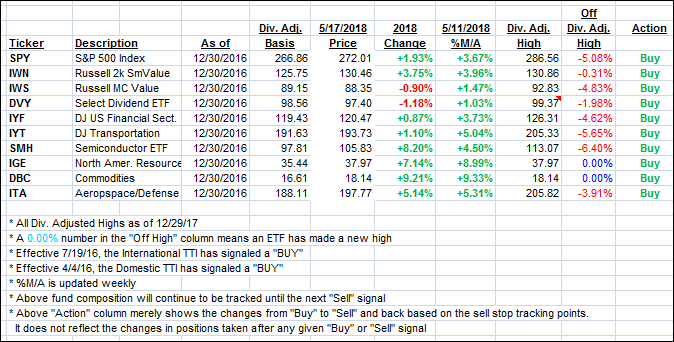
Again, the %M/A column above shows the position of the various ETFs in relation to their respective long term trend lines, while the trailing sell stops are being tracked in the “Off High” column. The “Action” column will signal a “Sell” once the -7.5% point has been taken out in the “Off High” column.
- Trend Tracking Indexes (TTIs)
Our Trend Tracking Indexes (TTIs) closed mixed.
Here’s how we closed 05/17/2018:
Domestic TTI: +1.99% above its M/A (last close +2.00%)—Buy signal effective 4/4/2016
International TTI: +2.71% below its M/A (last close +2.49%)—Buy signal effective 7/19/2016
Disclosure: I am obliged to inform you that I, as well as my advisory clients, own some of the ETFs listed in the above table. Furthermore, they do not represent a specific investment recommendation for you, they merely show which ETFs from the universe I track are falling within the guidelines specified.
Contact Ulli