Financial Chaos In Italy = Dumping Equity Markets

Ulli Market Commentary Contact

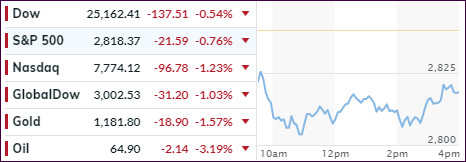
[Chart courtesy of MarketWatch.com]
  1. Moving the markets

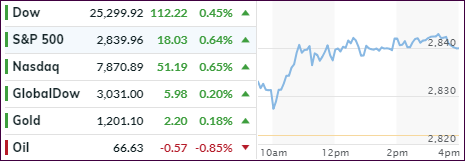
Italy’s political turmoil, along with its banking crisis, which I alluded to last Friday, continued over the weekend and into today pushing worldwide markets to the downside. The major indexes took a hit as well but recovered slightly late in the session, which some observers thought to be an appearance by the Plunge Protection Team to limit the damage.

As always, ZeroHedge succinctly summarized the meltdown best:

  1. Italian 2Y Yield biggest spike ever
  2. Italian risk curve inverted
  3. Italian ‘redenomination risk’ record high
  4. Spanish 2Y bond yields spike to 2Y highs
  5. Spanish ‘redenomination risk’ record high
  6. EU banks crash 11% in last 4 days to 18-month lows
  7. US banks plunge 4% to 6-month lows
  8. VIX back above 200DMA
  9. US 5Y Treasury yields plunges over 18bps – most since March 2009
  10. US 30Y Yield back below 3.00% – lowest in 7 weeks
  11. Dollar Index spiked to 6-month highs

While Italy may face fresh elections later on this year, Spanish markets were hit as well with the parliament starting the process for a no confidence vote against PM Rajoy creating a sea of red numbers in exchanges around the world.

Then Deutsche Bank (DB), long caught in a downside spiral, and facing a possible S&P downgrade, saw its stock price sink another -6.22% to $11.30 and within striking distance to the red line in the sand, namely the $10 level. Remember, with DB’s large exposure to Italian bonds, and being the world’s largest holder of derivatives, a potential demise would have a domino effect around the world.

Benefiting from all this panic around the world were Treasury Bonds, which rallied sharply with their yields dropping some 13-18 basis points, as the hunt for perceived safety continued. The 10-year yield closed down 16 basis points to end at 2.77%, far away from the danger zone known as the 3% level.

Also gaining from this turmoil was the US dollar (UUP), which closed up 0.69% to make new 6 month highs. If these events prove to be contagious, and further affect equities, we may be heading for the safety of the sideline in the near future, but the jury still out. At the same time, these uncertainties may make the Fed’s next planned 3 rate hikes obsolete.

Read More

ETFs On The Cutline – Updated Through 05/25/2018

Ulli ETFs on the Cutline Contact

Below please find the latest High Volume ETFs Cutline report, which shows how far above or below their respective long-term trend lines (39 week SMA) my currently tracked ETFs are positioned.

This report covers the HV ETF Master List from Thursday’s StatSheet and includes 366 High Volume ETFs ETFs, defined as those with an average daily volume of more than $5 million, of which currently 168 (last week 185) are hovering in bullish territory. The yellow line separates those ETFs that are positioned above their trend line (%M/A) from those that have dropped below it.

Take a look:

The HV ETF Master Cutline Report

In case you are not familiar with some of the terminology used in the reports, please read the Glossary of Terms.

If you missed the original post about the Cutline approach, you can read it here.

ETF Tracker Newsletter For May 25, 2018

Ulli ETF Tracker Contact

ETF Tracker StatSheet

https://theetfbully.com/2018/05/weekly-statsheet-for-the-etf-tracker-newsletter-updated-through-05-24-2018/

CRUDE OIL TUMBLES AND MAJOR INDEXES SLIP

[Chart courtesy of MarketWatch.com]
  1. Moving the markets

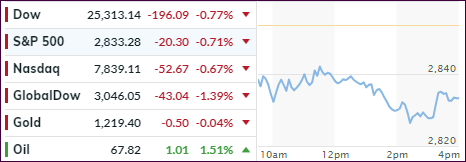
Crude oil took a dive today (-4.5%) as reports that OPEC, along with other major players in this arena, may increase production by as much as $1 million barrels a day. The energy sector followed suit with XLE dropping -2.6% for the session and -4.5% for the week.

The major indexes fared better despite having a see-saw week and, while slipping today, managed to eke out some small gains for the past 5 trading days by adding +0.2% (Dow), +0.3% (S&P) and 1.1% (Nasdaq).

Geopolitical headlines dominated, and it appears that the U.S./N. Korea summit may be back on after Trump’s cancellation yesterday. There was no impact on market behavior during today’s session as this on/off cycle now appears meaningless and may be repeated several more times.

Turmoil in other markets continues, especially in bonds where the bears, betting on higher rates, have been slaughtered recently as 10-year yields, which made a high of 3.11%, suddenly turned around and headed south closing today at 2.93%.

And the trouble in Europe took center stage with ZeroHedge reporting Italy as the biggest headline maker:

  1. Italian stocks worst week since Nov 2016 (US election)
  2. Italian stocks worst two-week drop Jun 2016 (Brexit)
  3. Italian banks worst week since Jun 2016 (Brexit)
  4. Italian 2Y Spread to Bunds biggest spike since July 2012
  5. Italian redenomination risk biggest spike ever to record high…

As I said before, events from Europe, as well as negative developments from Deutsche Bank (DB), have the ability to affect markets and interest rates in the U.S. For example, European banks had a downright ugly week, which caused their U.S. counterparts to suffer as well although to a lesser degree.

What caused this sudden reversal in bond yields? No one has the answer yet, but it could be, just maybe, that the widely proclaimed strength in the U.S. economy is not what it’s cracked up to be. It certainly is a possibility motivating the Fed to ease up a bit on its intention of higher rates, and letting inflation shoot past its intended 2% target in order to not negatively impact the economy.

We’ll have to be patient and wait for the outcome. In the meantime, I hope you’re having a great and relaxing Memorial weekend.

Read More

Weekly StatSheet For The ETF Tracker Newsletter – Updated Through 05/24/2018

Ulli ETF StatSheet, Uncategorized Contact

ETF Data updated through Thursday, May 24, 2018

Methodology/Use of this StatSheet:

  1. From the universe of over 1,800 ETFs, I have selected only those with a trading volume of over $5 million per day (HV ETFs), so that liquidity and a small bid/ask spread are assured.
  2. Trend Tracking Indexes (TTIs)

Buy or Sell decisions for Domestic and International ETFs (section 1 and 2), are made based on the respective TTI and its position either above or below its long-term M/A (Moving Average). A crossing of the trend line from below accompanied by some staying power above constitutes a “Buy” signal. Conversely, a clear break below the line constitutes a “Sell” signal. Additionally, I use a 7.5% trailing stop loss on all positions in these categories to control downside risk.

  1. All other investment arenas do not have a TTI and should be traded based on the position of the individual ETF relative to its own respective trend line (%M/A). That’s why those signals are referred to as a “Selective Buy.” In other words, if an ETF crosses its own trendline to the upside, a “Buy” signal is generated. Since these areas tend to be more volatile, I recommend a wider trailing sell stop of 7.5% -10% depending on your risk tolerance.

If you are unfamiliar with some of the terminology, please see Glossary of Terms and new subscriber information in section 9.


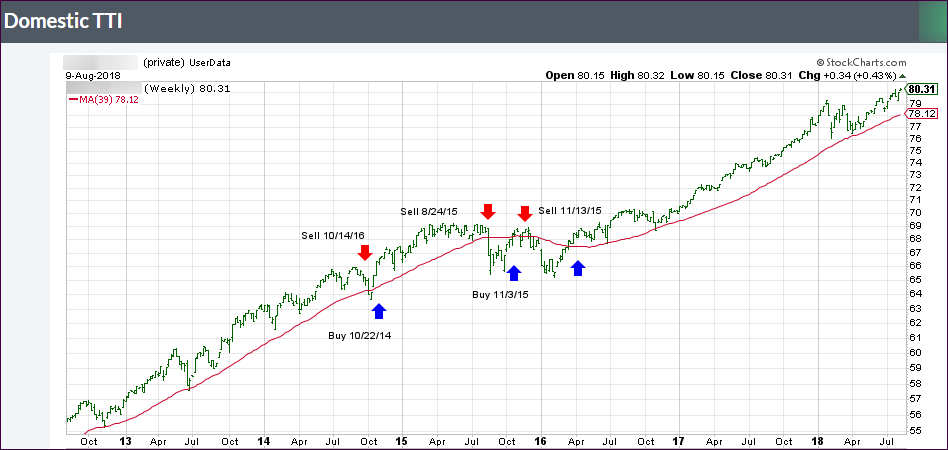
  1. DOMESTIC EQUITY ETFs: BUY — since 4/4/2016

Click on chart to enlarge

Our main directional indicator, the Domestic Trend Tracking Index (TTI-green line in the above chart) is positioned above its long-term trend line (red) by +2.04% after having generated a new Domestic Buy signal effective 4/4/2016 as posted.

Read More

Equities Dive And Thrive

Ulli Market Commentary Contact

[Chart courtesy of MarketWatch.com]
  1. Moving the markets

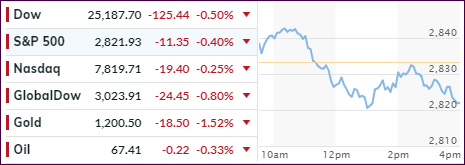
The Major Indexes took a steep dive right after the opening bell caused by geopolitical concerns, as President Trump canceled the widely anticipated summit with N. Korea’s Kim Jong Un. The reason given was alleged “open hostility” from the country.

Not helping matters was weakness in the energy sector (-1.7%) and in financials (-0.7%). However, the markets found a bottom at mid-morning thanks to dip-buyers, which was followed by a slow climb back towards the unchanged line. Even though we fell short, the early morning losses were sharply reduced.

Far more concerning to me is the state of affairs of Deutsche Bank (DB), the largest derivatives holder in the world with over $50 trillion, while the market capitalization of the bank has dwindled down to some $22 billion. Why is that important?

The bank appears to be crumbling with its stock price now approaching the critical $10 level and that in the face of an upcoming possible S&P downgrade within the next couple of weeks. A downgrade could put the bank in danger of collapsing, which would have a ripple effect around the world as this bank has huge systemic risk. Take a look at this chart and be amazed as to which institutions might be affected…

Interest rates continued to do an about face with the 10-year bond yield slipping not just 3 basis points to 2.98% but closing below the psychologically important line in the sand, namely the 3% level. Whether this current down trend will continue or not is anybody’s guess, but if it does, it certainly could give a boost to equities.

Read More

Early Slide Followed By A Late Ramp

Ulli Market Commentary Contact

[Chart courtesy of MarketWatch.com]
  1. Moving the markets

For most of the session, the major indexes were aimlessly meandering below their respective unchanged lines waiting for the release of the Fed minutes in anticipation of possible changes to interest rate policy.

In a sense, that wait was rewarded as markets interpreted the FOMC minutes as “dovish” meaning that rate hikes may not arrive in such an aggressive manner as anticipated. Although the Fed pretty much confirmed a June hike, the 2% inflation target, which was hit back in March, was adjusted. It was noted that if inflation moves slightly above that target, it might do so only temporarily.

In other words, the 2% level is no longer a hard number to be strictly adhered to. Or, you could interpret this as “we’ll move the goal posts whenever it suits our purpose.”

Market reaction was instant with bond yields tumbling as the 10-year slipped back to its 3% level scoring its biggest drop in just about 2 months and settling at one-week lows. Bond prices, which move opposite to yields, were the beneficiary with the 20-year bond (TLT) gaining +0.73%.

The major indexes scrambled back above their respective unchanged lines and scored modest gains with the Nasdaq leading the pack with +0.64%, while the US Dollar (UUP) reduced early gains but still ended up +0.41%.

Read More