ETF Tracker StatSheet
MARKETS END A MISERABLE WEEK IN A SEA OF RED
- Moving the markets
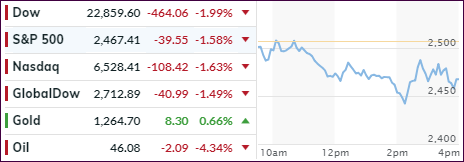
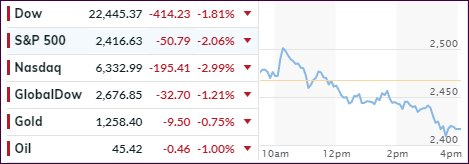
Here we go again. An early bounce ran into resistance, as bears upheld their dominance and sent the major indexes into a tailspin with the Dow registering another 400-point loss leaving some traders stunned and speechless. That’s no surprise to me, as most participants haven’t been around long enough to know what causes bear markets, how to identify one and how to stay out of harms way.
It was an ugly week with the Dow and S&P 500 down around -7% (yes, that is for the week!) while the Nasdaq (and SmallCaps) tumbled a more dramatic -8.4%. The tech index has now officially slipped into a bear market, which is defined as a drop of at least 20% from its recent high.
ZH adds that this was the worst week for the Dow and Nasdaq since October 2008 and the worst week for the S&P 500 since August 2011. All three indexes have now closed lower the last 5 out of 6 weeks:
From the 52-week highs:
- Dow -16%
- S&P -17%
- Nasdaq 100 -21% – BEAR
- Nasdaq Composite -22% – BEAR
- Trannies -23.6% – BEAR
- Small Caps -26% – BEAR
The culprits taking the starch out of the early rebound were the same with fears of a partial government shutdown, slowing global growth and rising interest rates taking top billing.
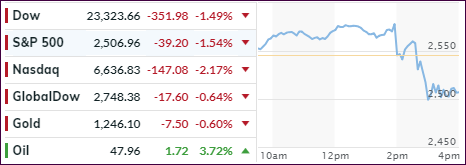
Then Fed governor Williams came out to try to jawbone the markets higher, which worked for a while until his comment “the balance sheet runoff is on auto-pilot,” reversed the modest rally.
Not to be outdone, Trump’s trade advisor Peter Navarro chimed in that a “trade pact with China within 90 days may prove to be difficult.” That appeared to be the final nail in the bullish coffin and down we went. This graph depicts precisely the market reaction to Williams and Navarro.
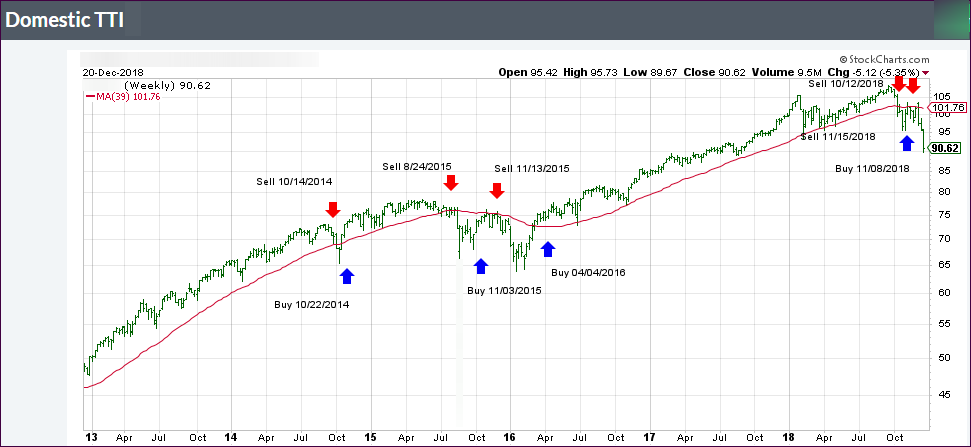
At this time it seems that the Smart Money indicator is spot on meaning things could get really ugly from here. Sure, we’re bound to see a rebound with legs that holds short-term, but the major trend remains bearish until my TTIs prove otherwise.
As of today, the S&P 500 has tumbled -11.84% since the effective date of our Domestic “Sell” signal on 11/15/2018.