
- Moving the markets
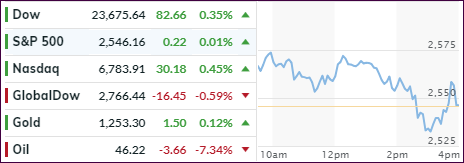
Today was a repeat of what we’ve seen a lot of lately. An early rally reversed mid-day, headed south below the unchanged line, but a last-minute bullish push shoved the major indexes back into the green, but only by a tiny margin.
The walls of worry remain a deterioration in global growth and the upcoming results tomorrow of the Fed’s two-day meeting on interest rates. Will the Fed cave and become dovish or stay the course set on a hawkish path?
A more dovish view could ignite the bulls—at least on a temporary basis and create the much-desired Santa Claus rally. What exactly is it? Trader’s Almanac defines it as follows:
The Santa Claus rally is a “short, sweet, respectable rally within the last five days of the year and the first two in January” with an average gain of 1.3%. It warns, however, that “Santa’s failure to show tends to precede bear markets”.
If that were to happen, the average gain would not be enough for the markets to climb out of their bearish range, at least the way I define it as per my Trend Tracking Indexes (TTI). It would merely represent a bounce in an ongoing bear market.
So far, and that is hard to believe, December has extended its worst performance since, get this, 1931! With global markets showing weakness wherever you look, today it was Crude Oil that got spanked at the tune of -7.34% with a hard landing at $46.22/barrel. Oil prices have now collapsed 40% from recent highs, and the Fed is scheduled to hike rates?
Hmm…
It promises to be an interesting day tomorrow.
- ETFs in the Spotlight
In case you missed the announcement and description of this section, you can read it here again.
It features 10 broadly diversified and sector ETFs from my HighVolume list as posted every Saturday. Furthermore, they are screened for the lowest MaxDD% number meaning they have been showing better resistance to temporary sell offs than all others over the past year.
The below table simply demonstrates the magnitude with which some of the ETFs are fluctuating regarding their positions above or below their respective individual trend lines (%M/A). A break below, represented by a negative number, shows weakness, while a break above, represented by a positive percentage, shows strength.
For hundreds of ETF choices, be sure to reference Thursday’s StatSheet.
Year to date, here’s how our original candidates have fared:
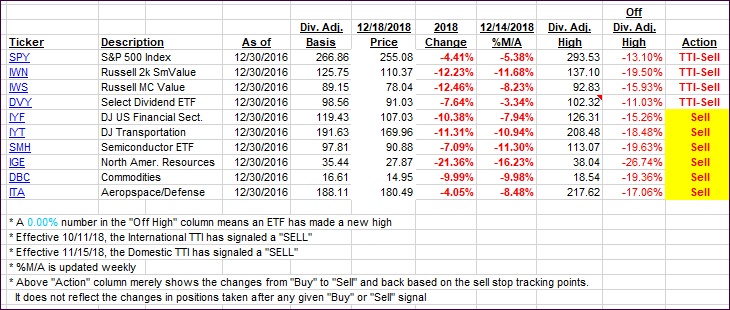
Again, the %M/A column above shows the position of the various ETFs in relation to their respective long-term trend lines, while the trailing sell stops are being tracked in the “Off High” column. The “Action” column will signal a “Sell” once the -8% point has been taken out in the “Off High” column. For more volatile sector ETFs, the trigger point is -10%.
- Trend Tracking Indexes (TTIs)
Our Trend Tracking Indexes (TTIs) headed further south with especially the International one showing more weakness.
Here’s how we closed 12/18/2018:
Domestic TTI: -8.21% below its M/A (last close -8.09%)—Sell signal effective 11/15/2018
International TTI: -8.24% below its M/A (last close -7.66%)—Sell signal effective 10/11/2018
Disclosure: I am obliged to inform you that I, as well as my advisory clients, own some of the ETFs listed in the above table. Furthermore, they do not represent a specific investment recommendation for you, they merely show which ETFs from the universe I track are falling.
Contact Ulli