
- Moving the markets
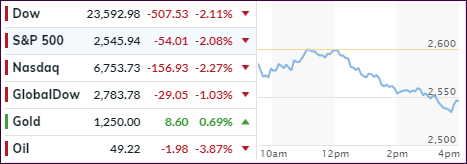
The Dow dropped some 300 points right after the opening but managed to recover and return to the unchanged line, before a massive selling bout sent it back down some 500 points. All 3 major indexes lost in excess of 2%.
Intra-day, the S&P 500 took out its February low for the year (2,532.69) but managed to close above it by a fraction. As I mentioned before, the odds have now increased that this low point will be taken out on a closing basis. Other stats show that more than half of the S&P 500 stocks (53%) are now in a bear market, meaning they have come off their highs by more than 20%, which is a clear sign that the decline has been broad.
To add insult to injury, one historian remarked that this is the worst start to a December since 1950. Ouch! Selling accelerated in the afternoon, as hedge funds went into liquidation overdrive with “computer buying algos” being conspicuously absent, which can cause prices to fall without much resistance.
And that’s when the exit doors can get really crowded, as I have warned about on various occasions. That means you need to be out before mass hysteria sets in. While we have not seen outright capitulation, it could happen at any time.
For context, ZH summed up the day as follows:
- Dow -12.7% from highs (correction)
- S&P -13.7% from highs (correction)
- Nasdaq Composite -17.3% from highs (correction)
- Dow Transports -19.4% from highs (correction)
- Russell 2000 -20.6% from highs (bear market)
- S&P’s lowest close since October 2017…taking out the intra-day lows from February…
What could turn this bearish trend around?
On deck is the final Fed meeting of the year, with the results being announced this Wednesday. I don’t recall the Fed being so scrutinized as they are these days with traders wondering whether they will hike ¼ point or not. The hike was a foregone conclusion a few weeks ago. However, recent statements by Fed head Powell indicated a more “dovish” tone making the outcome of their meeting questionable.
My view is this: Should they hike in the face of a weakening domestic and global economy, you will see the markets take another dive. However, if the Fed blinks and not hike, you might see the bulls appear again trying to dig themselves out of a hole via a relief rally. Whether this rally will be enough to re-establish the bullish trend is doubtful, but you can never be sure.
It’s good to watch this movie from the sidelines…
- ETFs in the Spotlight
In case you missed the announcement and description of this section, you can read it here again.
It features 10 broadly diversified and sector ETFs from my HighVolume list as posted every Saturday. Furthermore, they are screened for the lowest MaxDD% number meaning they have been showing better resistance to temporary sell offs than all others over the past year.
The below table simply demonstrates the magnitude with which some of the ETFs are fluctuating regarding their positions above or below their respective individual trend lines (%M/A). A break below, represented by a negative number, shows weakness, while a break above, represented by a positive percentage, shows strength.
For hundreds of ETF choices, be sure to reference Thursday’s StatSheet.
Year to date, here’s how our original candidates have fared:
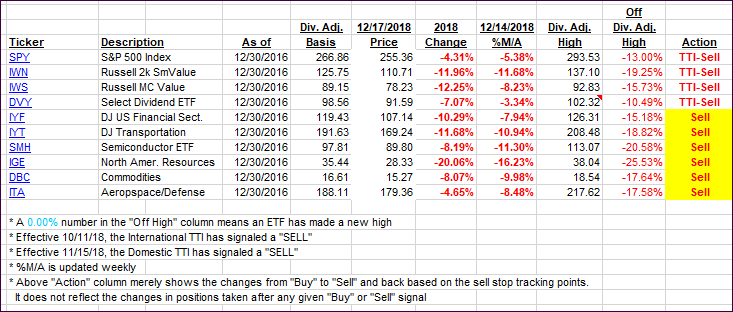
Again, the %M/A column above shows the position of the various ETFs in relation to their respective long-term trend lines, while the trailing sell stops are being tracked in the “Off High” column. The “Action” column will signal a “Sell” once the -8% point has been taken out in the “Off High” column. For more volatile sector ETFs, the trigger point is -10%.
- Trend Tracking Indexes (TTIs)
Our Trend Tracking Indexes (TTIs) took a dive and became more entrenched in bear territory.
Here’s how we closed 12/17/2018:
Domestic TTI: -8.09% below its M/A (last close -6.05%)—Sell signal effective 11/15/2018
International TTI: -7.66% below its M/A (last close -5.67%)—Sell signal effective 10/11/2018
Disclosure: I am obliged to inform you that I, as well as my advisory clients, own some of the ETFs listed in the above table. Furthermore, they do not represent a specific investment recommendation for you, they merely show which ETFs from the universe I track are falling.
Contact Ulli