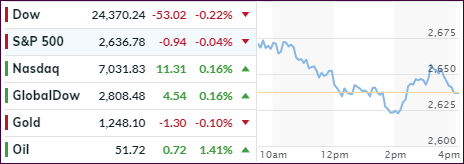
ETFs On The Cutline – Updated Through 12/14/2018

Ulli ETFs on the Cutline Contact

Below, please find the latest High-Volume ETF Cutline report, which shows how far above or below their respective long-term trend lines (39-week SMA) my currently tracked ETFs are positioned.

This report covers the HV ETF Master List from Thursday’s StatSheet and includes 322 High Volume ETFs, defined as those with an average daily volume of more than $5 million, of which currently 48 (last week 51) are hovering in bullish territory. The yellow line separates those ETFs that are positioned above their trend line (%M/A) from those that have dropped below it.

Take a look:

The HV ETF Master Cutline Report

In case you are not familiar with some of the terminology used in the reports, please read the Glossary of Terms.

If you missed the original post about the Cutline approach, you can read it here.

ETF Tracker Newsletter For December 14, 2018

Ulli ETF Tracker Contact

ETF Tracker StatSheet

https://theetfbully.com/2018/12/weekly-statsheet-for-the-etf-tracker-newsletter-updated-through-12-13-2018/

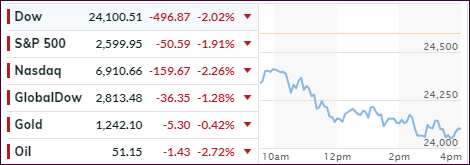
MARKETS ON EDGE: MAJOR INDEXES GET CLOBBERED AGAIN
[Chart courtesy of MarketWatch.com]
  1. Moving the markets

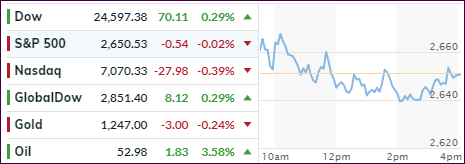
As hard as I tried, there was simply no news item to be found anywhere to support the cause for the bulls. US PMI plunged and confirmed a near-record streak of disappointing global data, US Manufacturing disappointed and has stagnated for the 2nd month in a row, while Johnson & Johnson shaved over 100 points off the Dow.

JNJ tanked 10% after reports that the company knew that its baby talcum powder was contaminated with asbestos, a fact that they allegedly had known for decades but failed to disclose to regulators. Ouch!

Poor economic data from China to Europe set the stage early on, as global markets headed south and uncertainty over the unresolved issues of the US/China trade dispute made its presence felt, while growth concerns were coming back into focus.

To no surprise, the major indexes took the path of least resistance and dove with the Dow giving back almost 500 points. The S&P 500 closed at the critical support level of 2,600 and, if  broken, will likely make new lows for the year.

ZH summed up the week like this:

  1. Dow -10.5% from highs
  2. S&P -11.3% from highs – lowest weekly close since March 2018
  3. Nasdaq Comp -14.6% from highs
  4. Trannies -17.8% from highs – Nov 2017 lows, worst 2-week drop since Aug 2011
  5. Russell 2000 -18.5% from highs – lowest since Sept 2017

Faring even worse were the S&P Banks and Financials, which are both down over 20% off their highs confirming that they are firmly engrained in bear market territory.

For the time being, I believe we are only in the early innings of an impending bear market. While things could turn on a dime, should the bulls find some new ammo, fundamentally global economies have moved into stagnation mode.

Until that changes, and our Trend Tracking Indexes (TTIs) give a new bullish signal, it’s best to be out and stay on the sidelines rather than watch your portfolio potentially get decimated. On that note, since the effective date of our latest Domestic Sell signal (11/15/18), the S&P 500 has dropped -4.60%.

Read More

Weekly StatSheet For The ETF Tracker Newsletter – Updated Through 12/13/2018

Ulli ETF StatSheet Contact

ETF Data updated through Thursday, December 13, 2018

Methodology/Use of this StatSheet:

  1. From the universe of over 1,800 ETFs, I have selected only those with a trading volume of over $5 million per day (HV ETFs), so that liquidity and a small bid/ask spread are assured.
  2. Trend Tracking Indexes (TTIs)

Buy or Sell decisions for Domestic and International ETFs (section 1 and 2), are made based on the respective TTI and its position either above or below its long-term M/A (Moving Average). A crossing of the trend line from below accompanied by some staying power above constitutes a “Buy” signal. Conversely, a clear break below the line constitutes a “Sell” signal. Additionally, I use a 7.5% trailing stop loss on all positions in these categories to control downside risk.

  1. All other investment arenas do not have a TTI and should be traded based on the position of the individual ETF relative to its own respective trend line (%M/A). That’s why those signals are referred to as a “Selective Buy.” In other words, if an ETF crosses its own trendline to the upside, a “Buy” signal is generated. Since these areas tend to be more volatile, I recommend a wider trailing sell stop of 7.5% -10% depending on your risk tolerance.

If you are unfamiliar with some of the terminology, please see Glossary of Terms and new subscriber information in section 9.


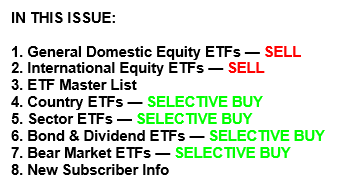
  1. DOMESTIC EQUITY ETFs: SELL — since 11/15/2018

Click on chart to enlarge

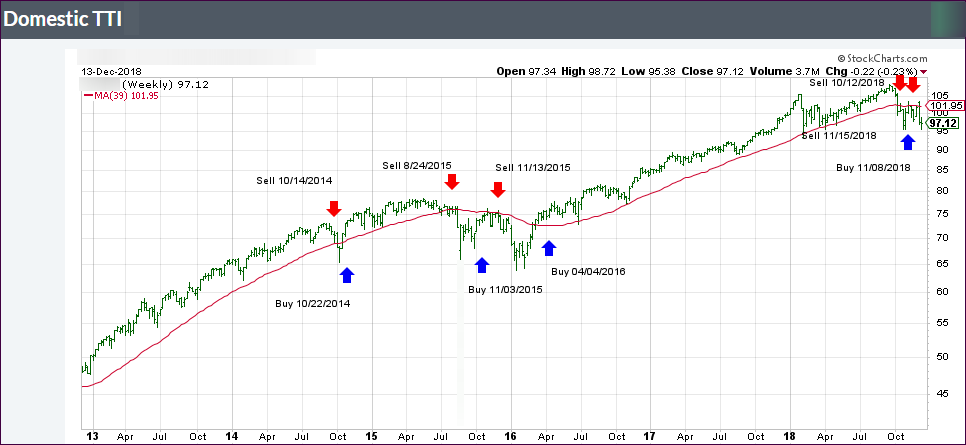
Our main directional indicator, the Domestic Trend Tracking Index (TTI-green line in the above chart) is now positioned below its long-term trend line (red) by -4.84% after having generated a new Domestic “Sell” signal effective 11/15/18 as posted.

Read More

Zig-Zagging To Nowhere

Ulli Market Commentary Contact

[Chart courtesy of MarketWatch.com]
  1. Moving the markets

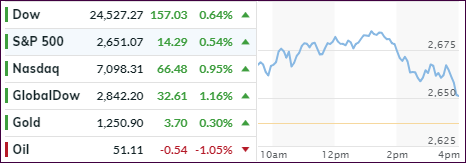
And the same story continues. An early rally ran into overhead resistance with markets fading the remainder of the session with neither bulls nor bears winning the tug-of-war as the “sell the rip” theme lingered on. The major indexes closed mixed with only the Dow squeezing out a fractional gain, while the S&P 500 and Nasdaq slipped into the red.

Looking across all markets, we saw that Transportations (IYT) took a dive, surrendered -1.59% and sank to new lows for 2018 bringing its loss YTD to -7.36%, while airline stocks crashed. Delta’s 2019 profit view was the culprit, as it missed expectations. Banks stock joined the trip to lower prices after a brief bounce of hope yesterday.

Bond yields seem to have found a temporary bottom, at least for the 10-year, which is lending support at the 2.80% level, as this chart shows. However, today’s move was minor and had no effect on equity direction. The markets need to find a new driver to support bullish hope but, until that emerges, we may be riding the bearish range for a while.

Read More

Giving Back Most Of The Early Gains

Ulli Market Commentary Contact

[Chart courtesy of MarketWatch.com]
  1. Moving the markets

An early ramp ran into resistance around mid-day when sentiment turned bearish, and sellers pulled the major indexes not just off their high points but also to a close at the lows of the day. Good thing the clock ran out, or we might have seen another reversal with nothing to show for.

As it turned out, the major indexes managed to score some modest gains with early support coming from the main recent driver of market direction, namely boosted expectations that a US/China trade deal might materialize in the coming months. Translated, that means to me that we’ll be riding this roller-coaster a while longer until something definite and verifiable can be reached between the jawboning parties.

Other positives out of China were news that they might allow foreign corporations greater access to their markets, and that they will lower tariffs on US autos and increase soybean purchases. While these are steps in the right direction, they were simply not enough to keep early upward market momentum going, as headlines about Cohen and National Enquirer disclosure offset the exuberant mood.

In the end, the modest gains certainly were not enough to conquer any bearish tendencies, as our Trend Tracking Indexes (TTIs) improved slightly but remain firmly entrenched below their respective long-term trend lines.

Read More

Traders Sell The Rip

Ulli Market Commentary Contact

[Chart courtesy of MarketWatch.com]
  1. Moving the markets

An early follow through to the upside from yesterday’s rebound ran into resistance quickly, as traders were more comfortable adopting the mantra “let’s sell the rip” rather than believing the rally had substance to it.

The Dow and the S&P 500 surrendered all gains and closed in the red with the Nasdaq barely hanging on to the plus side. Opinions vary widely these days about the Santa Claus rally with one analyst referring to it as a “violent and crushing move higher” taking shape this month.

While that is certainly possible, but maybe not probable, the question in my mind remains whether that would be just another bear-market blow-off, or an actual break back into bullish territory. I guess we’ll have to wait for the answer.

The news headlines were the same in today’s choppy session. Optimism around US/China trade talks faded in a hurry with market momentum losing even more steam on Trump’s threat of a government shutdown, as border-wall funding talks with Democratic leaders turned into a nothing burger.

Markets hate uncertainty the most, and that’s why we ended up at the unchanged line. For the time being, our bearish view remains alive and well with our Trend Tracking Indexes (section 3) continue to be positioned below their respective trend lines.

Read More