
- Moving the markets
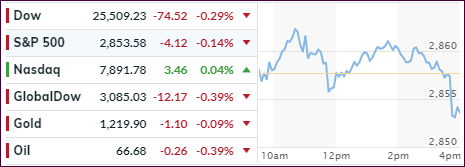
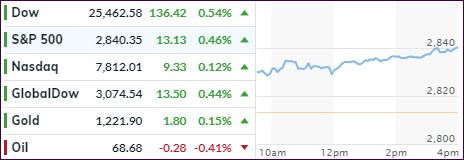
In a repeat from yesterday, the Nasdaq managed to eke out another win, although only by the tiniest of margins, which was enough to log in its 8th straight gain, its best streak since October. The broader market see-sawed all day and ended up diving into the close registering small losses.
Looking at the chart above, it seems apparent that the tug-of-war continued. On one side, we have solid earnings with the number of companies beating estimates being a the highest since 2009, according to JP Morgan.
On the other side, and I hate to have to repeat myself, are the lingering trade tensions between the US and China, where the latest news headline creates either a bullish or bearish effect on market direction causing the see-saw outcome we witnessed today.
The latest economic data were inconsequential with initial jobless claims falling more than expected, while the July producer index (PPI) was flat with expectations calling for a +0.2% rise. That helped bond yields to pull back with the 10-year dropping 3 basis points to 2.93%.
With the focus having been on earnings and interest rates here in the US, I don’t think that the domestic equity markets have priced in any long-term consequences of a prolonged trade war with China, reeling emerging markets and European banking problems. These are all issues that could provide a hefty headwind soon but, for right now, everything seems to be looked at through rose colored glasses.