
- Moving the markets
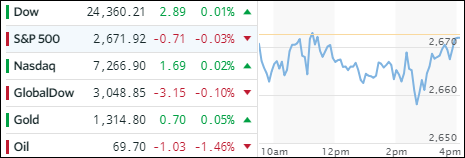
The much awaited and hyped up announcement by President Trump regarding the Iran nuclear pact had the major indexes, which hovered below their respective unchanged lines all morning, dipping down at first but managing to rebound to close essentially unchanged. Trump confirmed withdrawal from the pact and announced “the highest level of sanctions against Iran.”
While details were lacking, the markets pretty much took it in stride—so far—with most of the volatility occurring in the oil sector. The defense arena benefited as Israel bomb shelter headlines seem to play the drums of war. Domestically, Transportations lead with +0.76%, followed by Semiconductors and SmallCaps with +0.70% and +0.49% respectively.
Helping the markets gain some footing, after Trump’s announcement, was the VIX, which got pushed down to the 14 level thereby making sure that the Iran uncertainty supported the bulls and not the bears. Interest rates rose slightly with the 10-year bond yield creeping closer the 3% level, while the US Dollar (UUP) kept his recent strength alive by gaining +0.37%.
I don’t the market reaction to the Iran drama is over yet, and we’ll have to see how things play out over the next few days.
- ETFs in the Spotlight
In case you missed the announcement and description of this section, you can read it here again.
It features 10 broadly diversified and sector ETFs from my HighVolume list as posted every Saturday. Furthermore, they are screened for the lowest MaxDD% number meaning they have been showing better resistance to temporary sell offs than all others over the past year.
The below table simply demonstrates the magnitude with which some of the ETFs are fluctuating in regards to their positions above or below their respective individual trend lines (%M/A). A break below, represented by a negative number, shows weakness, while a break above, represented by a positive percentage, shows strength.
For hundreds of ETF choices, be sure to reference Thursday’s StatSheet.
Year to date, here’s how our candidates have fared so far:
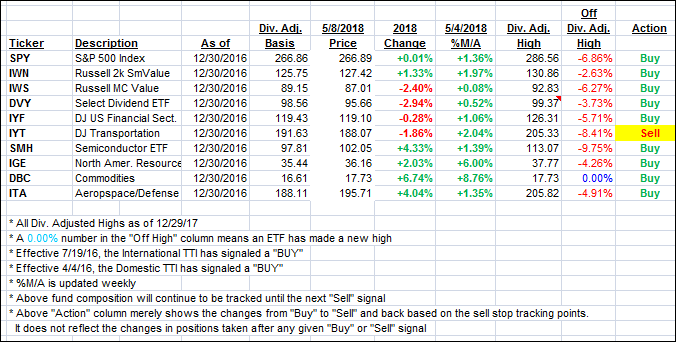
Again, the %M/A column above shows the position of the various ETFs in relation to their respective long term trend lines, while the trailing sell stops are being tracked in the “Off High” column. The “Action” column will signal a “Sell” once the -7.5% point has been taken out in the “Off High” column.
- Trend Tracking Indexes (TTIs)
Our Trend Tracking Indexes (TTIs) barely changed as the indexes ended up hugging the unchanged line.
Here’s how we closed 05/08/2018:
Domestic TTI: +1.54% above its M/A (last close +1.41%)—Buy signal effective 4/4/2016
International TTI: +1.64% below its M/A (last close +1.60%)—Buy signal effective 7/19/2016
Disclosure: I am obliged to inform you that I, as well as my advisory clients, own some of the ETFs listed in the above table. Furthermore, they do not represent a specific investment recommendation for you, they merely show which ETFs from the universe I track are falling within the guidelines specified.
Contact Ulli