A Whip-Saw Day But Bull Trend Strengthens

Ulli Market Commentary Contact

[Chart courtesy of MarketWatch.com]
  1. Moving the markets

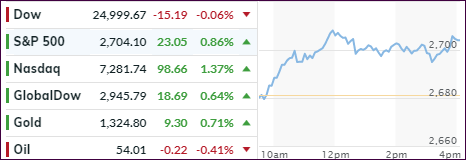
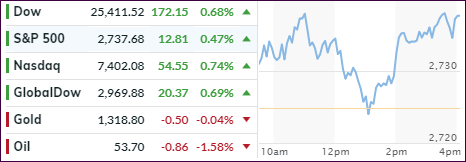
One look at the chart tells the story. An early rebound failed miserably with the S&P 500 dipping back into the red, then recovering and closing at the early high of the session. All eyes are now on the 200-day M/A, which today acted as overhead resistance.

At 2,742 we are only some 4 points away from conquering that level, which Wall Street considers to be the return to the bullish theme. Our Domestic TTI has already crossed into bullish territory and, should momentum not change much over the next couple of days, will generate a new ‘Buy’ signal.

If the S&P 500 manages to crawl back above its line, it will have been the fastest V-shape recovery on record considering that only at Christmas the index was hovering in bear market territory, mostly defined as a drop of 20% or more off recent highs.

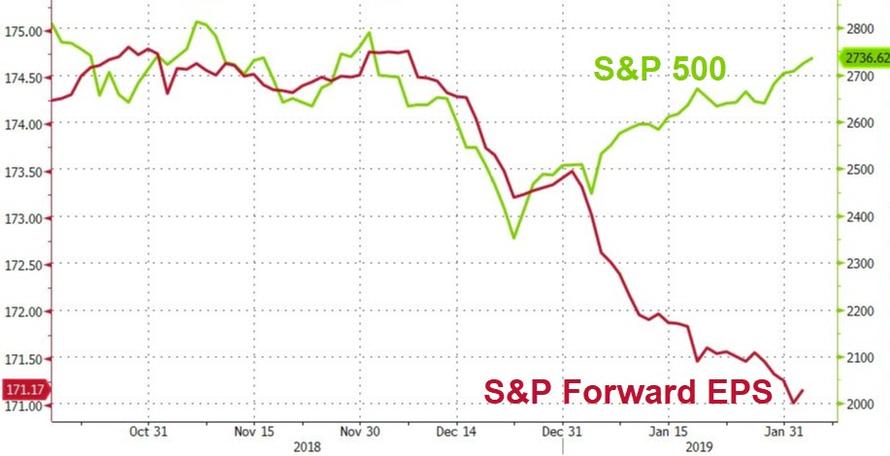
While this has been the best start to a year for the S&P 500 since 1987, as ZH points out, it has been the worst start for earnings expectations in 3 years. However, be that as it may, I am preparing to re-enter the markets and will post the exact entry date.
Read More

Tech Leads The Way And Posts Solid Gains

Ulli Market Commentary Contact

[Chart courtesy of MarketWatch.com]
  1. Moving the markets

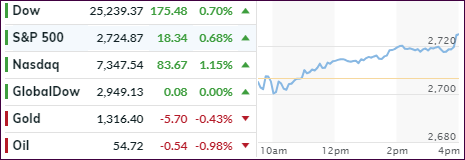
Despite a slow start, the major indexes picked up some steam and closed higher with technology leading the charge as the Nasdaq added +1.15%. Assisting the advance was a positive view of Alphabet’s (Google) upcoming quarterly report card and another round of earnings by some 97 members of the S&P 500.

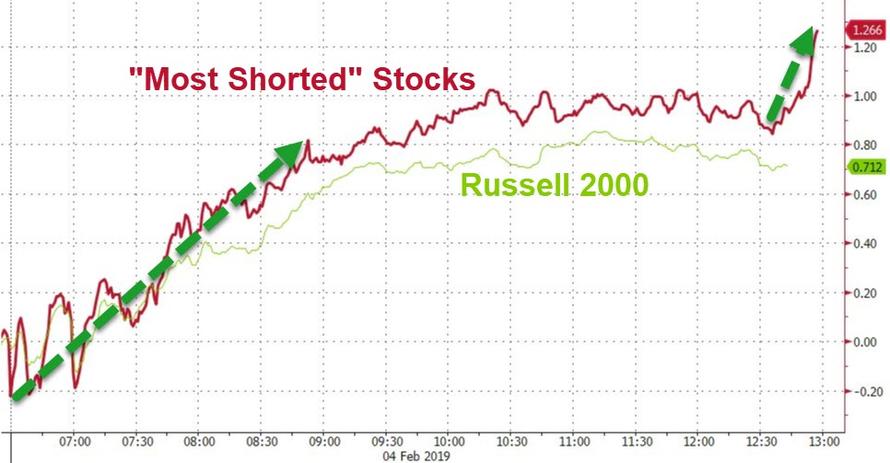
The markets in general continued to benefit from the Fed’s latest dovish signal that interest rate hikes were on hold until further notice. As I posted before, this fact more than any other will contribute to further upward momentum in support of equities. Of course, the continued short-squeeze helped the bullish cause as well.

On deck I see possible additional market support in form of the China trades talks, which so far have been a headwind to equity markets. That could change in a hurry if some verifiable positive headlines about the March 1 deadline (increase in tariffs) show that a solution has been found and accepted by the warring parties.

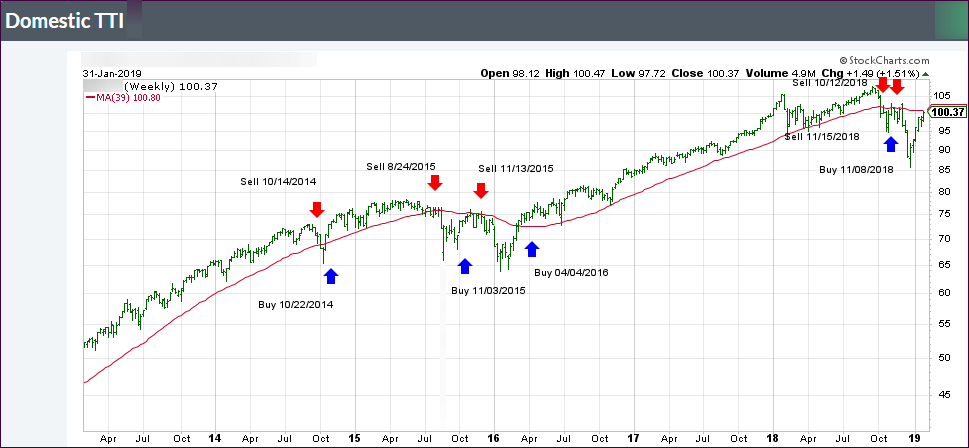
With today’s action, our leading indicator, the Domestic Trend Tracking Index (TTI), has crawled above its trend line (see section 3) into bullish territory for the first time since 11/15/18. It’s now hovering at +0.36% above the line, and I need to see a little staying power before a new ‘Buy’ signal will be triggered.

Read More

ETFs On The Cutline – Updated Through 02/01/2019

Ulli ETFs on the Cutline Contact

Below, please find the latest High-Volume ETF Cutline report, which shows how far above or below their respective long-term trend lines (39-week SMA) my currently tracked ETFs are positioned.

This report covers the HV ETF Master List from Thursday’s StatSheet and includes 322 High Volume ETFs, defined as those with an average daily volume of more than $5 million, of which currently 111 (last week 84) are hovering in bullish territory. The yellow line separates those ETFs that are positioned above their trend line (%M/A) from those that have dropped below it.

Take a look:

The HV ETF Master Cutline Report

In case you are not familiar with some of the terminology used in the reports, please read the Glossary of Terms.

If you missed the original post about the Cutline approach, you can read it here.

ETF Tracker Newsletter For February 2, 2019

Ulli ETF Tracker Contact

ETF Tracker StatSheet

https://theetfbully.com/2019/01/weekly-statsheet-for-the-etf-tracker-newsletter-updated-through-01-31-2019/

Up For The Week But Running Out Of Steam For The Day

[Chart courtesy of MarketWatch.com]
  1. Moving the markets

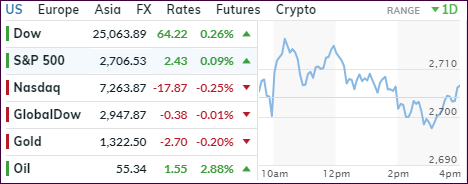
Choppy and sloppy best describes the last trading day, a week during which the major indexes gained but ran out of steam, as an early rally faded into the close with the Dow coming off the high by some 150 points.

Despite the Nasdaq notching a 1.4% rise over the past 5 days, today it was the anchor that kept any advances in check predominantly due to Amazon’s earnings announcement that revenues for the Q1 2019 would fall short of expectations. Amazon’s stock price has now been down for 2 straight weeks.

For this week, the S&P 500 advanced +1.6%, the Dow added +1.3% while the Nasdaq gained +1.4%. All thanks to the Fed’s slamming on the monetary brakes and caving to Wall Street by signaling “patience” regarding any future policy changes as opposed to the more hawkish behavior shown 3 months ago.

Interest rates rose today with the 10-year bond yield gaining 5 basis points to settle at 2.68%. The driving factor here was the jobs reports showing that the U.S. gained 304k jobs vs. 172k expected, the biggest increase in almost a year. Of course, this number is subject to the usual at times sharp revisions. Case in point is the December figure, which was slashed from an initial estimate of 312k to 222k.

Our Domestic Trend Tracking Index (TTI) inched a tad higher and is now within striking distance of crossing its long-term trend line to the upside and into bullish territory. Please see the exact numbers in section 3 below. If the current bullish sentiment continues, we may very well be inching back into equity ETFs in the near future.

Read More

Weekly StatSheet For The ETF Tracker Newsletter – Updated Through 01/31/2019

Ulli ETF StatSheet Contact

ETF Data updated through Thursday, January 31, 2019

Methodology/Use of this StatSheet:

  1. From the universe of over 1,800 ETFs, I have selected only those with a trading volume of over $5 million per day (HV ETFs), so that liquidity and a small bid/ask spread are assured.
  2. Trend Tracking Indexes (TTIs)

Buy or Sell decisions for Domestic and International ETFs (section 1 and 2), are made based on the respective TTI and its position either above or below its long-term M/A (Moving Average). A crossing of the trend line from below accompanied by some staying power above constitutes a “Buy” signal. Conversely, a clear break below the line constitutes a “Sell” signal. Additionally, I use a 7.5% trailing stop loss on all positions in these categories to control downside risk.

  1. All other investment arenas do not have a TTI and should be traded based on the position of the individual ETF relative to its own respective trend line (%M/A). That’s why those signals are referred to as a “Selective Buy.” In other words, if an ETF crosses its own trendline to the upside, a “Buy” signal is generated. Since these areas tend to be more volatile, I recommend a wider trailing sell stop of 7.5% -10% depending on your risk tolerance.

If you are unfamiliar with some of the terminology, please see Glossary of Terms and new subscriber information in section 9.


  1. DOMESTIC EQUITY ETFs: SELL — since 11/15/2018

Click on chart to enlarge

Our main directional indicator, the Domestic Trend Tracking Index (TTI-green line in the above chart) is now positioned below its long-term trend line (red) by -0.38% after having generated a new Domestic “Sell” signal effective 11/15/18 as posted.

Read More

The Fed Pump Continues

Ulli Market Commentary Contact

[Chart courtesy of MarketWatch.com]
  1. Moving the markets

You could almost feel the giddiness of the Wall Street traders after Fed head Powell’s signal yesterday that interest rate hikes are on pause. He then surprised the markets with a separate statement indicating that a further unwind of its $4 trillion asset portfolio could end sooner than expected adding that market turbulence was a key consideration for this change.

In other words, the current unwinding, which is akin to QT (Quantitative Tightening), is now in the rear-view mirror, and any further softness in the markets may possibly be greeted with QE (Quantitative Easing), meaning that the Fed could step in to support asset prices. We now have a return to the Bernanke put, which is designed to rescue falling markets via a lowering of interest rates.

This is a “huuge” change and will likely mean that a new bull market is on deck, which may be confirmed by our Trend Tracking Indexes (TTIs) as early as next week. While we have seen a V-shape type of recovery since Christmas, that does not mean profits have been made. Far from it. With the losses of the last quarter, during which the S&P 500 dropped -14%, Buy-and-Hold investors have not broken even yet, but they made up a lot, as the S&P 500 recovered +7.9% in January.

Case in point: Since the effective date of our domestic ‘Sell’ signal on 11/15/18, the S&P 500 (SPY) is still down -1.18%. It means that as trend followers we did not participate in the drop and consequently were not involved in the rebound.

We now have seen as opposite of two markets as you can imagine. After the worst December in 100 years, the S&P 500 just experienced its best January in 32 years. Nothing fundamentally has changed regarding economic conditions, but the Fed has altered policy direction from hawkish to dovish.

Silly me, and I thought markets were freely traded…

Read More