
- Moving the markets
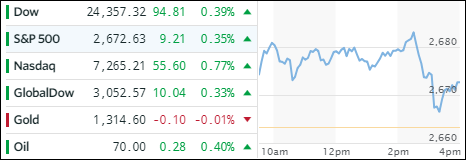
Last Friday’s winning ways continued this morning with the major indexes moving sideways but comfortably above the unchanged line. Then the Iran headlines appeared about Trump promising a decision tomorrow at 2 pm as to whether to de-certify the 2015 Iran nuclear pact and re-impose sanctions, which would hamper oil exports and interrupt the global supply chain.
That took the starch out of the rally and south we went, but the major indexes managed a green close. The S&P 500 dipped below its 200-day M/A on Friday but recovered and closed above it, while today, the index climbed above its 50-day M/A but closed below it. We’re still stuck in a wide sideways pattern, out of which we will eventually break out—either to the upside or to the downside.
Last week’s China trade headlines were in focus again, even though they resulted in no agreement after several days of talks other than Chinese news outlets reporting that “talks were positive” but more jawboning was needed to avoid a trade war. The markets were not affected, but this may change once the Trump/Iran deadline will have passed and other negative news reports become the main focus for the bears on Wall Street again.
- ETFs in the Spotlight
In case you missed the announcement and description of this section, you can read it here again.
It features 10 broadly diversified and sector ETFs from my HighVolume list as posted every Saturday. Furthermore, they are screened for the lowest MaxDD% number meaning they have been showing better resistance to temporary sell offs than all others over the past year.
The below table simply demonstrates the magnitude with which some of the ETFs are fluctuating in regards to their positions above or below their respective individual trend lines (%M/A). A break below, represented by a negative number, shows weakness, while a break above, represented by a positive percentage, shows strength.
For hundreds of ETF choices, be sure to reference Thursday’s StatSheet.
Year to date, here’s how our candidates have fared so far:
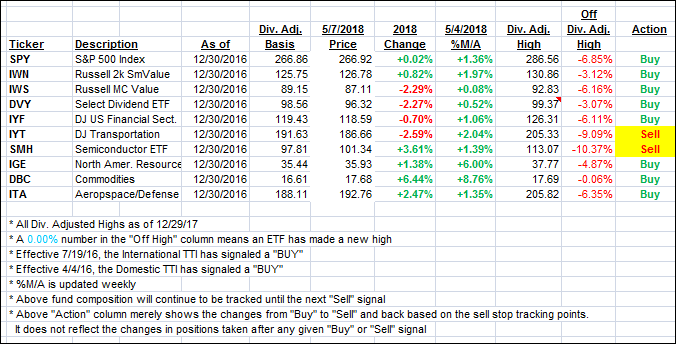
Again, the %M/A column above shows the position of the various ETFs in relation to their respective long term trend lines, while the trailing sell stops are being tracked in the “Off High” column. The “Action” column will signal a “Sell” once the -7.5% point has been taken out in the “Off High” column.
- Trend Tracking Indexes (TTIs)
Our Trend Tracking Indexes (TTIs) continued rebounding.
Here’s how we closed 05/07/2018:
Domestic TTI: +1.41% above its M/A (last close +1.23%)—Buy signal effective 4/4/2016
International TTI: +1.60% below its M/A (last close +1.37%)—Buy signal effective 7/19/2016
Disclosure: I am obliged to inform you that I, as well as my advisory clients, own some of the ETFs listed in the above table. Furthermore, they do not represent a specific investment recommendation for you, they merely show which ETFs from the universe I track are falling within the guidelines specified.
Contact Ulli