ETFs On The Cutline – Updated Through 11/02/2018

Ulli ETFs on the Cutline Contact

Below, please find the latest High-Volume ETF Cutline report, which shows how far above or below their respective long-term trend lines (39-week SMA) my currently tracked ETFs are positioned.

This report covers the HV ETF Master List from Thursday’s StatSheet and includes 366 High Volume ETFs, defined as those with an average daily volume of more than $5 million, of which currently 45 (last week 40) are hovering in bullish territory. The yellow line separates those ETFs that are positioned above their trend line (%M/A) from those that have dropped below it.

Take a look:

The HV ETF Master Cutline Report

In case you are not familiar with some of the terminology used in the reports, please read the Glossary of Terms.

If you missed the original post about the Cutline approach, you can read it here.

ETF Tracker Newsletter For November 2, 2018

Ulli ETF Tracker Contact

ETF Tracker StatSheet

https://theetfbully.com/2018/11/weekly-statsheet-for-the-etf-tracker-newsletter-updated-through-11-01-2018/

Trump Saves The Day For The Bulls

[Chart courtesy of MarketWatch.com]
  1. Moving the markets

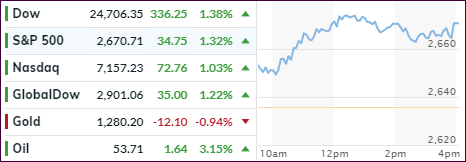
Sometimes you just have to laugh. The markets were in a downswing for most of the day mainly as a result of two events.

First, Apple’s earnings report card, while not bad, disappointed with especially their forward guidance not being very encouraging despite the upcoming Christmas season. The immediate punishment was a drop in the stock price of some 7%, which pulled the entire tech sector down over 1%.

Second, October payrolls surged by 250k and exceeded expectations. While that should have been good news, it wasn’t. On the contrary. This appears to be the nail in the interest rate coffin with a December hike now being virtually assured, as the report showed that wages rose at the fastest pace in nine years, which indicates that inflationary pressures are in our future. The unemployment rate remained at 3.7%, its lowest since 1969.

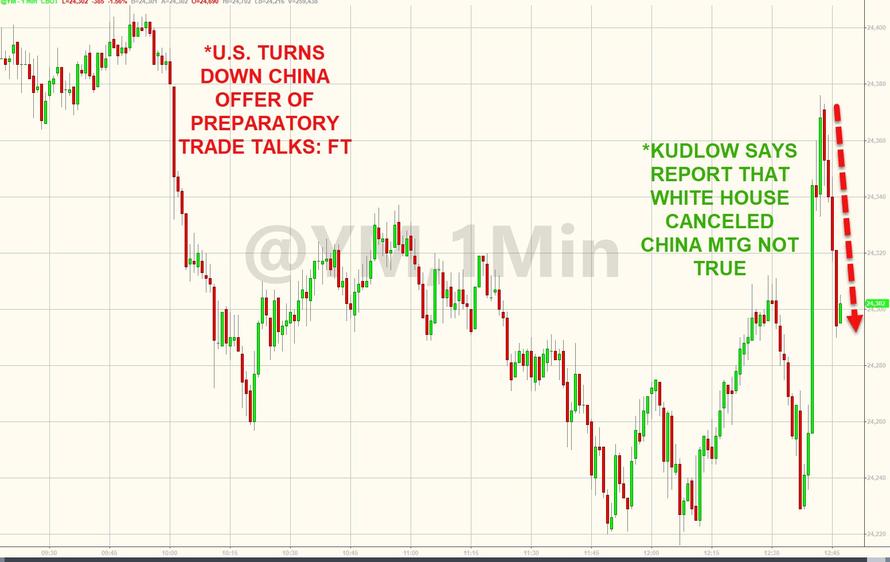
This caused the markets to pick up downward momentum with the Dow being down 250 points at one time. Then, Trump started to talk China trade. First, there were denials from three While House officials off the record and Larry Kudlow on the record that trade talks were progressing. Suddenly, during the last hour, Trump stepped up and told reporters that “China talks are going well,” “the US will reach a trade deal with China,” and “getting closer to doing something with China.”

That was enough to shift the computer algos not only into reverse but also into overdrive and mysterious buying pressure appeared out of nowhere, stocks recovered, and cut the mid-day losses in half. Looking at the entire week, it has become clear, that a giant short squeeze helped the bulls to climb out of a deep hole, but falling short of reversing the technical damage done in red October.

Bond yields surged by 8 basis points today with the 10-year closing at 3.22%. That clobbered the widely held 20-year bond ETF (TLT) by -1.24% to a level last seen in March of 2017.

We remain on the sidelines until our Domestic Trend Tracking Indexes (section 3) move back into bullish territory.

Read More

Weekly StatSheet For The ETF Tracker Newsletter – Updated Through 11/01/2018

Ulli ETF StatSheet Contact

ETF Data updated through Thursday, November 1, 2018

Methodology/Use of this StatSheet:

  1. From the universe of over 1,800 ETFs, I have selected only those with a trading volume of over $5 million per day (HV ETFs), so that liquidity and a small bid/ask spread are assured.
  2. Trend Tracking Indexes (TTIs)

Buy or Sell decisions for Domestic and International ETFs (section 1 and 2), are made based on the respective TTI and its position either above or below its long-term M/A (Moving Average). A crossing of the trend line from below accompanied by some staying power above constitutes a “Buy” signal. Conversely, a clear break below the line constitutes a “Sell” signal. Additionally, I use a 7.5% trailing stop loss on all positions in these categories to control downside risk.

  1. All other investment arenas do not have a TTI and should be traded based on the position of the individual ETF relative to its own respective trend line (%M/A). That’s why those signals are referred to as a “Selective Buy.” In other words, if an ETF crosses its own trendline to the upside, a “Buy” signal is generated. Since these areas tend to be more volatile, I recommend a wider trailing sell stop of 7.5% -10% depending on your risk tolerance.

If you are unfamiliar with some of the terminology, please see Glossary of Terms and new subscriber information in section 9.


  1. DOMESTIC EQUITY ETFs: SELL — since 10/12/2018

Click on chart to enlarge

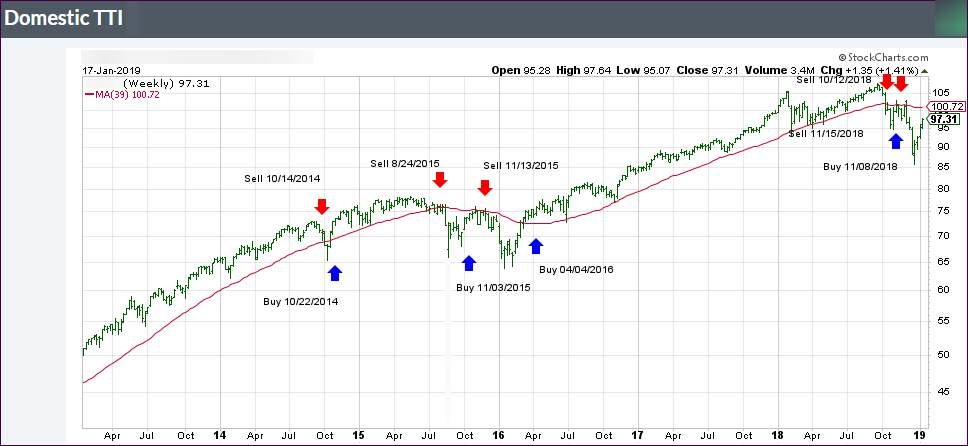
Our main directional indicator, the Domestic Trend Tracking Index (TTI-green line in the above chart) is now positioned below its long-term trend line (red) by -1.51% after having generated a new Domestic “Sell” signal effective 10/12/18 as posted.

Read More

Bouncing into November

Ulli Market Commentary Contact

[Chart courtesy of MarketWatch.com]
  1. Moving the markets

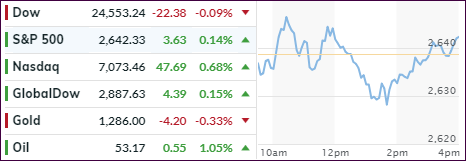
Continued hope for a trade resolution with China provided the assist the markets needed to score another winning session, it’s first 3-day win streak in six weeks. Also hope that Apples’ afterhours earnings report would be a blow-out event contributed to the upward thrust.

The overall positive tone from the US and China regarding their trade negotiations unleashed several things at once. First, the Chinese Yuan jumped sharply and second, we saw the biggest short squeeze since June 2016. While this effect was momentarily bullish, one look at this chart shows what happened last time after such an euphoric event.

The 1st fall guy was the US Dollar, which moved opposite of the surging Yuan and registered its biggest single-day drop since March, which gave gold a boost to the upside while breaking above its 100-day M/A. The 2nd fall guy was crude oil, which was hammered to the $63 level and homing in on bear market territory (-18% from the recent highs).

Today’s upbeat tone in the equity arena helped improve the positions of our Trend Tracking Indexes (see section 3), which are now heading towards a trend line break to the upside, but we are not there yet. However, another upswing along today’s magnitude may bring a new “Buy” signal into play—at least for the domestic arena.

Read More

Ending Red October On A High Note

Ulli Market Commentary Contact

[Chart courtesy of MarketWatch.com]
  1. Moving the markets

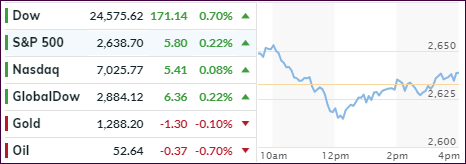
It truly was an ugly October, despite the hopeful rebound during the past couple of days, which left many traders wondering “are we there yet?” meaning “is the bottom in?” While the answer is elusive, some analysts point to tomorrow as being a make-or-break kind of day.

Why?

As I mentioned before, the FAANG stocks got hammered during October with only one stock in that composite having held up reasonably well, namely Apple, and they are due to report their quarterly results tomorrow. If Apple disappoints and falls, so goes the current theory, the overall market will likely follow. If its results are pleasing, the rally might continue. Again, these are simply wild Wall Street projections.

It wasn’t just domestic equities that joined in the rally, but global stocks as well, so everyone got a Halloween treat. Despite the past couple of “green” days, the month was a turbulent one and will go down in history as having seen the biggest losses in global equities since 2008 amounting to some $8 trillion. Still, the big picture shows that, while the world’s stocks (ex-US) are down almost 13% YTD, US equities are unchanged after having erased the entire year’s gains in October.

Technically speaking, the major indexes are still hovering below their respective 200-day M/As leaving the sentiment on the bearish side. This is confirmed by our Trend Tracking Indexes (section 3), which improved their positions during this 2-day rebound but are still stuck below the line, which separates the bulls from the bears.

We need to see more upside momentum, along with some staying power, before a new “Buy” signal will be generated.

Read More

Finally: A Rebound With Staying Power

Ulli Market Commentary Contact

[Chart courtesy of MarketWatch.com]
  1. Moving the markets

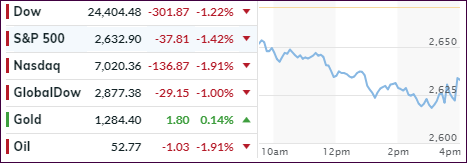
Despite today turning into another roller-coaster ride, with the S&P 500 crossing its unchanged line seven times, the bulls prevailed in the end by pushing the major indexes higher during a last hour attack. For sure, with the brutal selling spree of the past few weeks on traders’ minds, it was about time for a rebound with starch, which is exactly what we saw today.

The assists came from the fact that markets were simply oversold along with news by President Trump that a deal with China on trade “may” be reached. Whether there will be any staying power, or if this was an outlier, are questions which will be answered within the next couple of weeks or so.

Financial news certainly did not contribute to this afternoon’s levitation. Early on, GE’s earnings report was so bad that their dividend was cut, and their stock price was not only hammered by almost -10% but the price threatened to dip into single digits. Here’s a lesson for buy-and-holders: GE’s shares are now unchanged since 1995…

The billionaire masters of high finance and complicated algorithms, namely hedge funds, demonstrated quite some vulnerability during October. Actually, their meltdown accelerated as the Hedge fund index clearly shows. Additionally, this month was their worst month on record. This most likely will cause further redemptions by customers, which means more asset liquidations, an outlook which would support the bearish theme.

In the end, my outlook did not change. The major equity indexes remain stuck below their respective 200-day M/As, joined by MSFT, which tumbled but managed to regain its 200-day M/A. With only one trading day left, the FANG stocks, while mixed today, got bloodied beyond recognition during the month.

It was indeed a red October.

Read More