
- Moving the markets
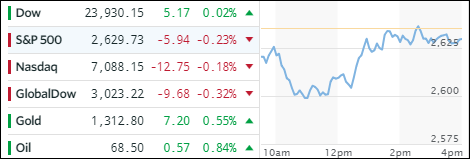
Another wild day in the markets pulled the major indexes way below the unchanged line with the Dow sinking some 400 points and the S&P 500 dropping below its 200-day M/A.
The cause of all this were the 2-day trade negotiations with China that had traders on edge when suddenly White House economist Calabria commented after day 1 that “he was ‘optimistic’ and that the US has ‘discreetly’ given China a list of asks and that the day ended “pretty positive.” That’s all Wall Street wanted to hear and off to the races we went.
What they did not want to hear and simply ignored, and may backfire later on, was Cambria’s conclusion that “the tough part in the talks is ensuring that China keeps its promises.” No joint statement was given at the end of the first day.
Be that as it may, only the Dow climbed back into the green, while the S&P and Nasdaq fell short. Nevertheless, despite the recovery, technical damage was done as the 200-day M/As were violated to the downside intra-day, the Dow and S&P managed to close back above it.
We’ll have to wait and see if this constant testing of the 200-day M/As will eventually cause a permanent break to the downside, which is sure to come with bearish consequences.
- ETFs in the Spotlight
In case you missed the announcement and description of this section, you can read it here again.
It features 10 broadly diversified and sector ETFs from my HighVolume list as posted every Saturday. Furthermore, they are screened for the lowest MaxDD% number meaning they have been showing better resistance to temporary sell offs than all others over the past year.
The below table simply demonstrates the magnitude with which some of the ETFs are fluctuating in regards to their positions above or below their respective individual trend lines (%M/A). A break below, represented by a negative number, shows weakness, while a break above, represented by a positive percentage, shows strength.
For hundreds of ETF choices, be sure to reference Thursday’s StatSheet.
Year to date, here’s how our candidates have fared so far:
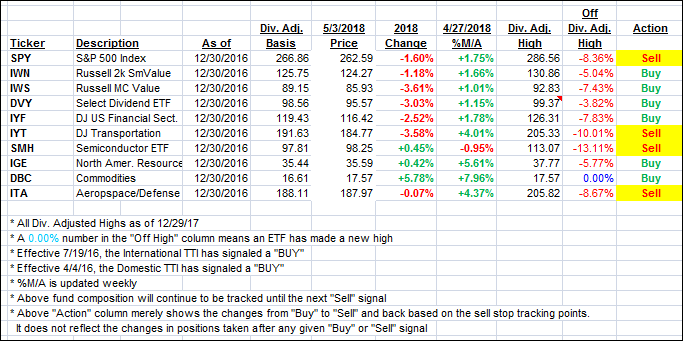
Again, the %M/A column above shows the position of the various ETFs in relation to their respective long term trend lines, while the trailing sell stops are being tracked in the “Off High” column. The “Action” column will signal a “Sell” once the -7.5% point has been taken out in the “Off High” column.
- Trend Tracking Indexes (TTIs)
Our Trend Tracking Indexes (TTIs) only slipped a fraction thanks to the massive afternoon rebound.
Here’s how we closed 05/03/2018:
Domestic TTI: +0.75% above its M/A (last close +0.78%)—Buy signal effective 4/4/2016
International TTI: +0.99% below its M/A (last close +1.01%)—Buy signal effective 7/19/2016
Disclosure: I am obliged to inform you that I, as well as my advisory clients, own some of the ETFs listed in the above table. Furthermore, they do not represent a specific investment recommendation for you, they merely show which ETFs from the universe I track are falling within the guidelines specified.
Contact Ulli