Due to a variety of business commitments, I will not be able to write today’s market commentary. Regular posting will resume tomorrow.
Ulli…

Due to a variety of business commitments, I will not be able to write today’s market commentary. Regular posting will resume tomorrow.
Ulli…
We started the day out in the red with some economic data contributing to the slide as US factory orders fell for the second month in a row. January pending home sales managed to rebound more than expected (+4.6% vs. 1% MoM) but continued to tumble year-over-year for the 13th straight month.
Then it was US trade rep Lighthizer’s turn to put out some negative vibes by stating that it’s “too early to tell” if a trade deal will happen, despite Trump and Xi planning to meet next month to iron out some details.
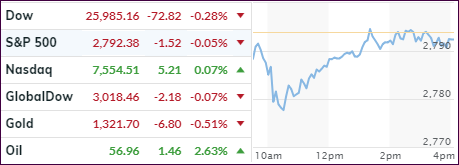
Equities tumbled but managed a mid-day come-back, which faded into the close. The Nasdaq reclaimed the unchanged line by the tiniest of margins, while the Dow and S&P 500 stayed slightly in the red.
It seems like we are witnessing a consolidation phase with the S&P 500 (SPY) knocking at the 2,800 level for the 4th time in 5 months, after the 3 prior attempts were rebuffed. If a break-through materializes, we’ll have a clear shot of taking out the old highs made last September. If it fails, we’ll be heading back south again.
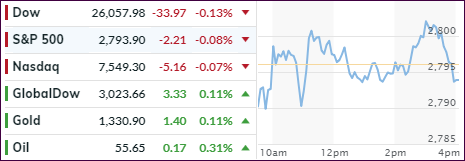
The markets were on standby this morning hanging on every word that Fed chair Powell was uttering at a congressional testimony. He confirmed that the central bank has adopted a wait-and-see approach due to some economic data having pointed to slower U.S. growth, despite a report showing an increase in consumer confidence.
He added that “the job market remains strong” and “we are seeing signs of stronger wage growth,” a remark that may have some members of his interest rate committee consider voting for a hike in rates in order to front-run any resulting inflation.
With no new earth-shaking news coming our way from the U.S.-China trade talks, the markets focused on the above, with bulls and bears slugging it out around the unchanged line with no clear winner at the end.
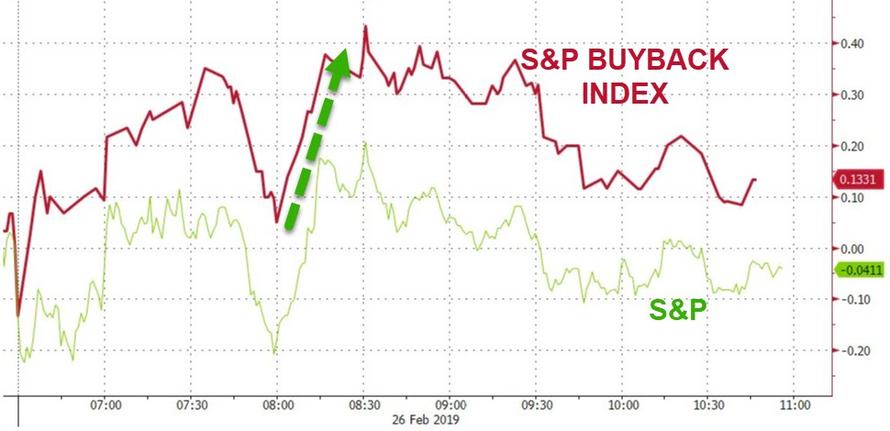
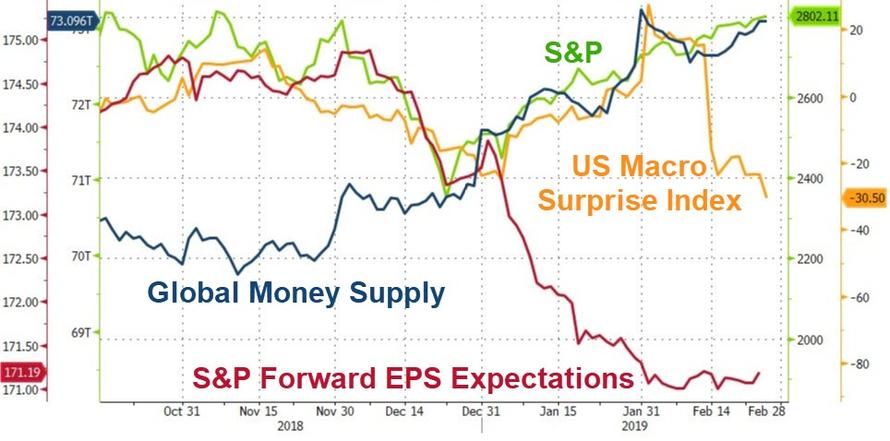
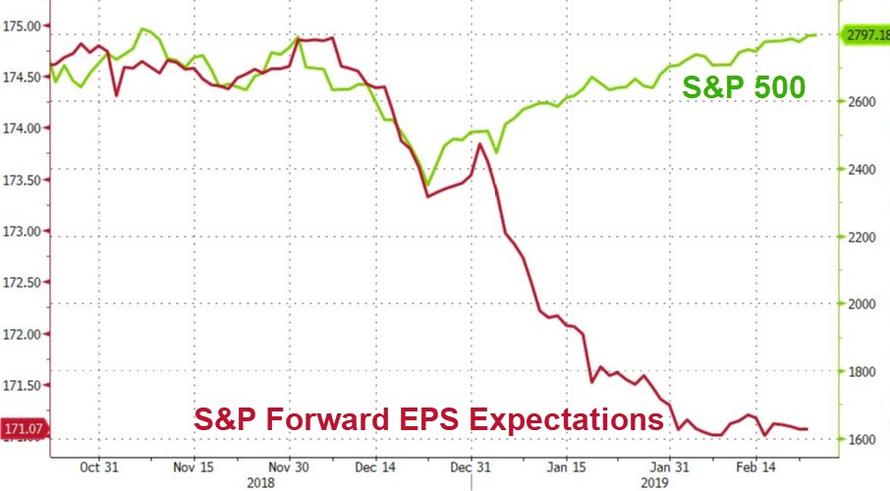
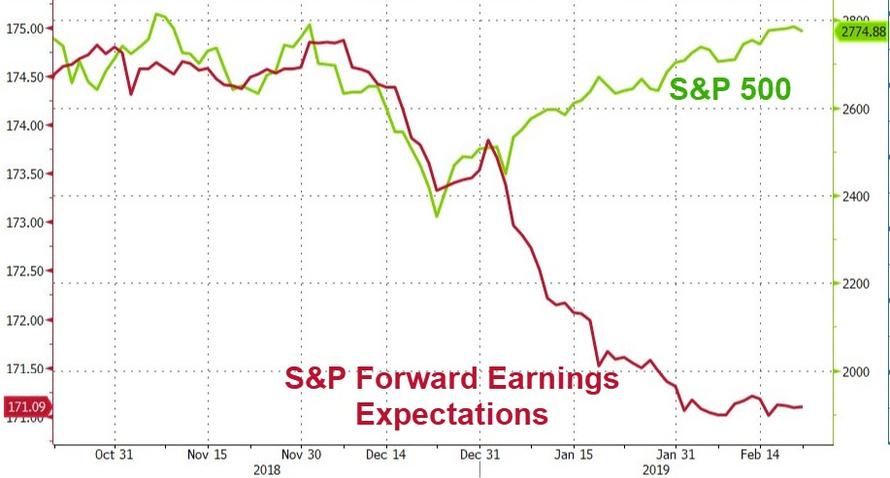
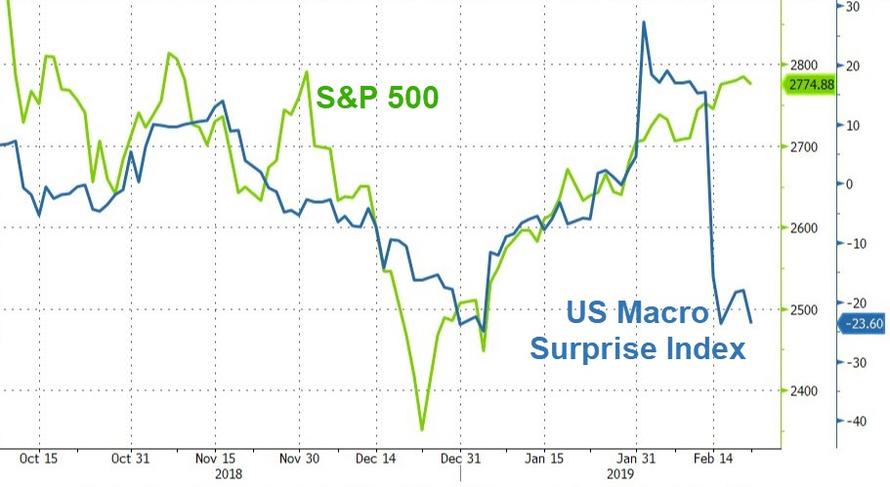
The S&P 500 ran into tough overhead resistance at the 2,800 level again and seemed to take directional cues from the S&P Buyback index. Looking at big picture, we see an interesting trend. Namely, that the S&P 500 follows Global Money Supply, while being out of sync with the US Macro Surprise Index and forward EPS expectations.
Eventually, something will have to give to bring these indicators back into alignment. Will the S&P 500 move down or will the other 2 indicators move up?
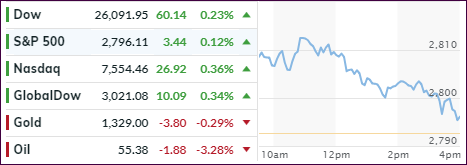
An early bounce had the S&P 500 piercing its overhead resistance zone, namely the 2,800 point. However, the index was not able to hold on, as a slow and steady decline pulled equities off their lofty levels. Good thing we ran out of time, or we might have seen a red close.
As it turned out, the major indexes ended up only fractionally in the green, as early euphoria, that Trump may be inclined to delay China tariffs, waned. But he said that “substantial progress” in trade talks have been made over the weekend.
So, the trade deal headlines appear to be a wonderful tool to keep the markets in check now that the earnings season has ended. Any economic news, no matter how poor they are, register as “good news” for the computer algos, as we’ve seen last week when retail sales collapsed.
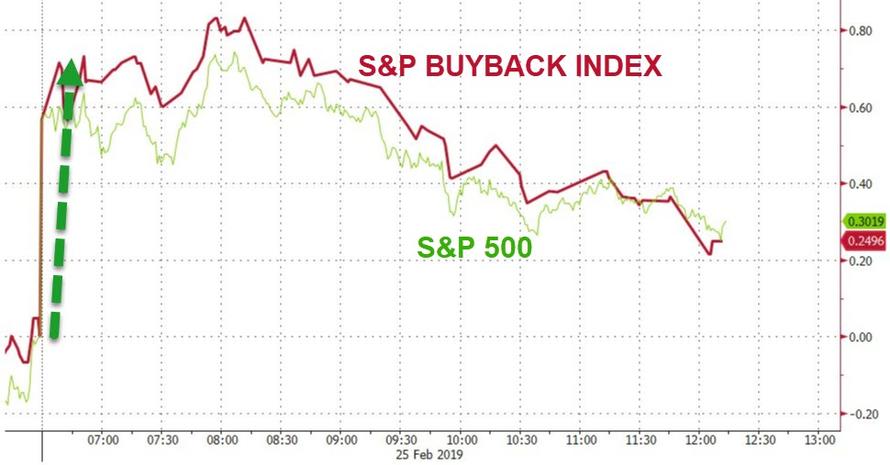
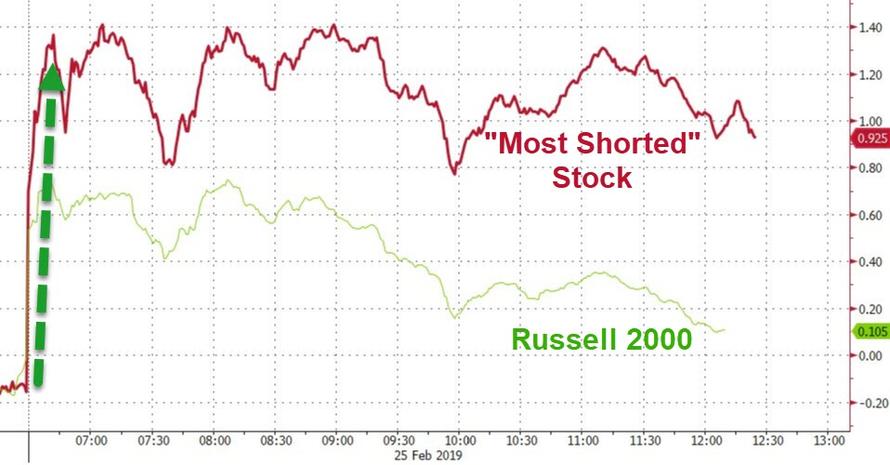
Additional assists supporting the early rally came from corporate buybacks and a huge short squeeze, both of which were the spark that got things going. And then there is this diversion, which, no matter how many times I post it, leaves me pondering: Who will be right in the end?
Below, please find the latest High-Volume ETF Cutline report, which shows how far above or below their respective long-term trend lines (39-week SMA) my currently tracked ETFs are positioned.
This report covers the HV ETF Master List from Thursday’s StatSheet and includes 322 High Volume ETFs, defined as those with an average daily volume of more than $5 million, of which currently 222 (last week 189) are hovering in bullish territory. The yellow line separates those ETFs that are positioned above their trend line (%M/A) from those that have dropped below it.
Take a look:
The HV ETF Master Cutline Report
In case you are not familiar with some of the terminology used in the reports, please read the Glossary of Terms.
If you missed the original post about the Cutline approach, you can read it here.
ETF Tracker StatSheet
A SEA OF GREEN; TRADE TALK OPTIMISM IS ALIVE AND WELL
It sure seems that complacency rules supreme when it comes to market behavior with yesterday’s bad news, when a bombardment of economic data missed, either being forgotten or at best can be seen in the rear-view mirror. Trade talks between U.S. and China are current front-page news—not much else seems to matter.
Northman Trader summed it up like this:
Bad data doesn’t matter because stocks go up. A China deal will be positive and a catalyst to buy stocks. If there is no real China deal a cosmetic one is good enough. Since bad data doesn’t matter any good data is bullish too. In short, bad news is good news and good news is good news.
It’s blind faith in a system that never has to face any consequences as the central bank put reigns supreme.
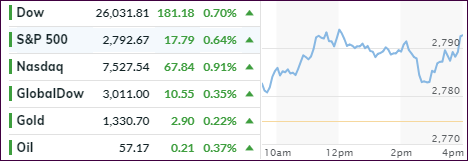
Be that as it may, equities opened in a sea of green across world markets thanks to the usual support cast, namely optimism about the trade talks.
The major indexes vacillated above the unchanged line and were never in danger of breaking it to the downside, despite a short-lived mid-day pullback that seemed to do nothing but strengthen the bullish resolve.
The Dow managed to reclaim its 26k level and close above it, while the S&P 500 stormed higher, but did not quite reach its major overhead resistance area, namely the 2,800 zone.
Still, despite this levitation to ever new heights, I wonder if eventually fundamentals, on which stock prices are really based, will kick in and take the starch out of this exuberance. After all, forward earnings are collapsing while the US Macro Surprise Index is not in sync with the S&P 500.
But all that matters right now, however, is the long-term trend, which is up and supported by our Trend Tracking Indexes (TTI). It confirms that the bull is alive and well—at least for the time being.