
- Moving the markets
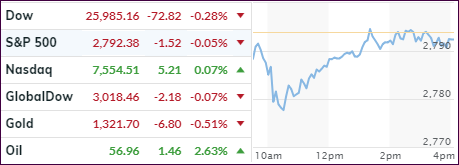
We started the day out in the red with some economic data contributing to the slide as US factory orders fell for the second month in a row. January pending home sales managed to rebound more than expected (+4.6% vs. 1% MoM) but continued to tumble year-over-year for the 13th straight month.
Then it was US trade rep Lighthizer’s turn to put out some negative vibes by stating that it’s “too early to tell” if a trade deal will happen, despite Trump and Xi planning to meet next month to iron out some details.
Equities tumbled but managed a mid-day come-back, which faded into the close. The Nasdaq reclaimed the unchanged line by the tiniest of margins, while the Dow and S&P 500 stayed slightly in the red.
It seems like we are witnessing a consolidation phase with the S&P 500 (SPY) knocking at the 2,800 level for the 4th time in 5 months, after the 3 prior attempts were rebuffed. If a break-through materializes, we’ll have a clear shot of taking out the old highs made last September. If it fails, we’ll be heading back south again.
- ETFs in the Spotlight
In case you missed the announcement and description of this section, you can read it here again.
It features 10 broadly diversified and sector ETFs from my HighVolume list as posted every Saturday. Furthermore, they are screened for the lowest MaxDD% number meaning they have been showing better resistance to temporary sell offs than all others over the past year.
The below table simply demonstrates the magnitude with which some of the ETFs are fluctuating regarding their positions above or below their respective individual trend lines (%M/A). A break below, represented by a negative number, shows weakness, while a break above, represented by a positive percentage, shows strength.
For hundreds of ETF choices, be sure to reference Thursday’s StatSheet.
Year to date, here’s how some our current candidates for this current ‘Buy’ cycle have fared:
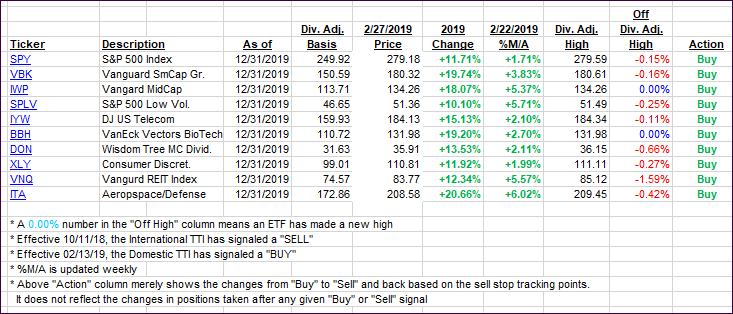
Again, the %M/A column above shows the position of the various ETFs in relation to their respective long-term trend lines, while the trailing sell stops are being tracked in the “Off High” column. The “Action” column will signal a “Sell” once the -8% point has been taken out in the “Off High” column. For more volatile sector ETFs, the trigger point is -10%.
- Trend Tracking Indexes (TTIs)
Our Trend Tracking Indexes (TTIs) were again mixed with the International one slipping and the Domestic one eking out a small gain.
Here’s how we closed 02/27/2019:
Domestic TTI: +3.25% above its M/A (last close +3.22%)—Buy signal effective 02/13/2019
International TTI: +1.69% above its M/A (last close +1.86%)—Buy signal effective 02/21/2019
Disclosure: I am obliged to inform you that I, as well as my advisory clients, own some of the ETFs listed in the above table. Furthermore, they do not represent a specific investment recommendation for you, they merely show which ETFs from the universe I track are falling within the specified guidelines.
Contact Ulli