Below, please find the latest High-Volume ETF Cutline
report, which shows how far above or below their respective long-term trend
lines (39-week SMA) my currently tracked ETFs are positioned.
This report covers the HV ETF Master List from Thursday’s
StatSheet and includes 322 High Volume ETFs, defined as those with an average
daily volume of more than $5 million, of which currently 226 (last week 259)
are hovering in bullish territory. The yellow line separates those ETFs that
are positioned above their trend line (%M/A) from those that have dropped below
it.
In case you are not familiar
with some of the terminology used in the reports, please read the Glossary of Terms.
If you missed the original
post about the Cutline approach, you can read it here.
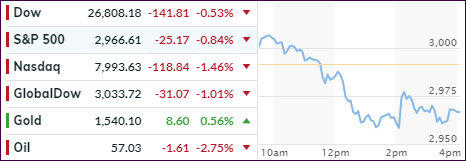
An early 100-point gain on the Dow evaporated
in a hurry and turned into a 150-point loss at one point, after a report that the
White House had thrown down the gauntlet by contemplating delisting Chinese stocks
from US Exchanges.
Of course, such a crackdown on capital flows
does not bode well for softening the intensity of the tariff battle being waged.
This news comes in the face of the warring parties having set an Oct. 10-11
date to meet to resolve their trade differences. I don’t see how this ratcheting
up of tensions will be of any value but, it could be simply a negotiation ploy.
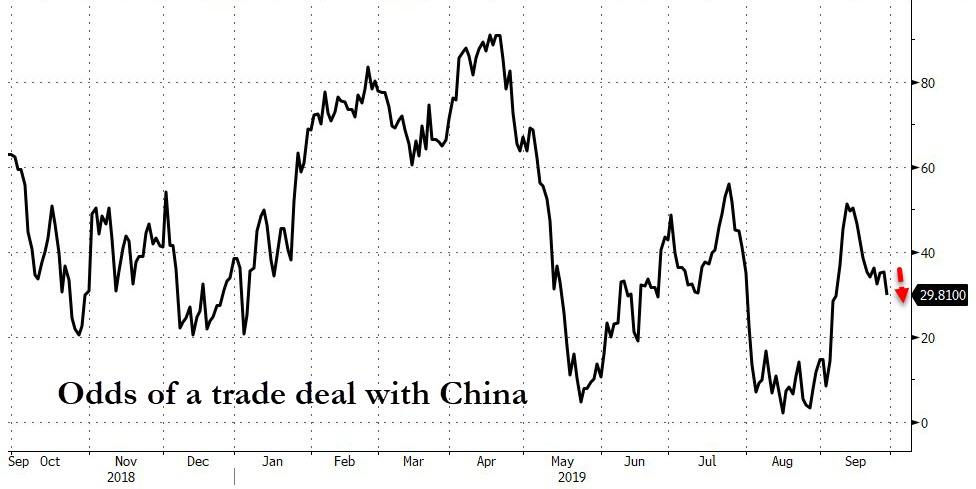
In the end, the odds
of a China deal slipped this week.
Economic data points were mixed with consumer
spending growth showing disappointing estimates, while orders for durable goods
rose 0.2% in August vs. expectations of a 0.7% decline. But the consumer sentiment
was revised upwards in September from 92 to 93.2, however, the index remains on
a downward trajectory.
On the week, equities fell with Small Caps
leading the drop and having its worst week since May 2019. As ZH pointed out, all
the major indexes tested or broke below key technical levels: The Nasdaq below
50 and 100 DMA; Russell 2000 below 200 DMA; S&P testing 50 DMA.
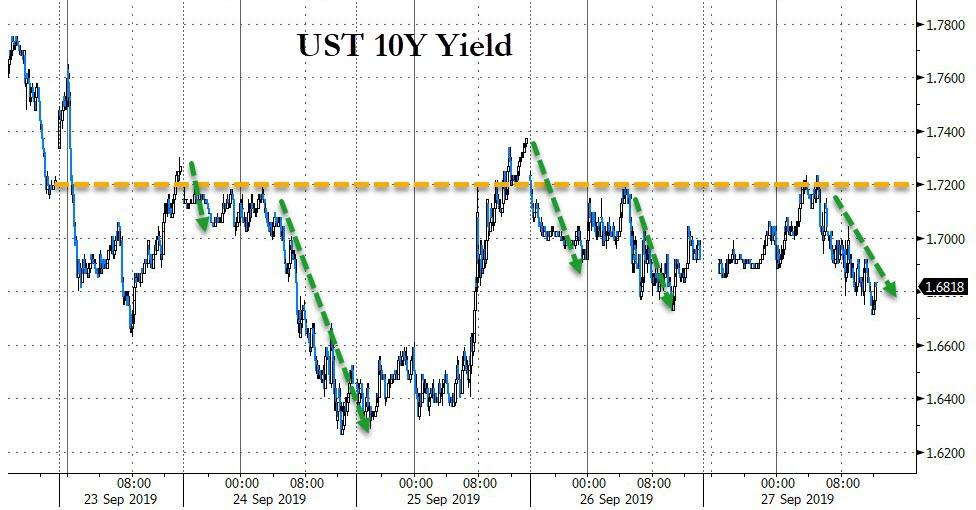
10-year yields attempted several times to break
out above the 1.70% level, but the efforts were rebuffed, and we closed the
week around the 1.68% area.
This was the second losing week in a row for the
S&P 500, but it’s still hanging on to a gain for the month. For sure, it looks
like a very positive trade headline is needed next week to get the bulls going
again.
ETF Data
updated through Thursday, September 26, 2019
Methodology/Use of this StatSheet:
1. From the universe of over 1,800 ETFs, I have selected only those with a
trading volume of over $5 million per day (HV ETFs), so that liquidity and a
small bid/ask spread are assured.
2. Trend Tracking Indexes (TTIs)
Buy or Sell decisions for Domestic and International ETFs (section 1 and
2), are made based on the respective TTI and its position either above or below
its long-term M/A (Moving Average). A crossing of the trend line from below
accompanied by some staying power above constitutes a “Buy” signal. Conversely,
a clear break below the line constitutes a “Sell” signal. Additionally, I use a
7.5% trailing stop loss on all positions in these categories to control
downside risk.
3. All other investment arenas do not have a TTI and should be traded
based on the position of the individual
ETF relative to its own respective trend line (%M/A). That’s why those signals
are referred to as a “Selective Buy.” In other words, if an ETF crosses its own
trendline to the upside, a “Buy” signal is generated. Since these areas tend to
be more volatile, I recommend a wider trailing sell stop of 7.5% -10% depending
on your risk tolerance.
If you are unfamiliar with some of the terminology, please see Glossary of Termsand new subscriber information in section 9.
1. DOMESTIC EQUITY ETFs: BUY
— since 02/13/2019
Click on chart to enlarge
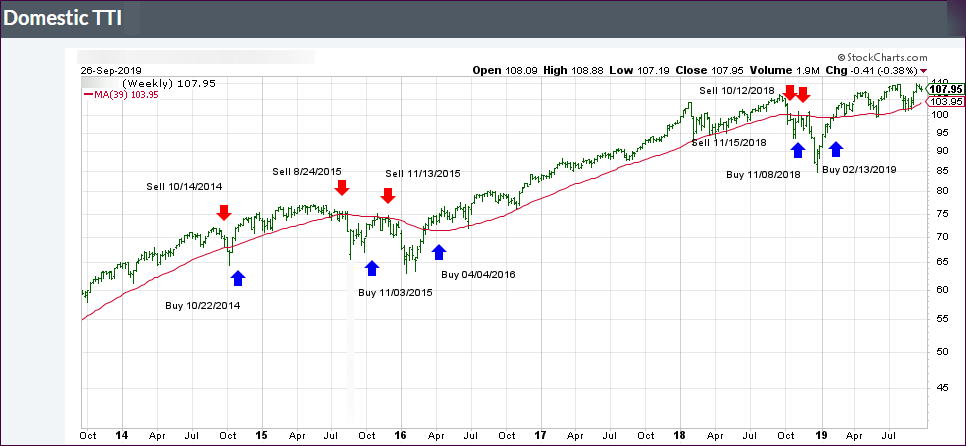
Our main directional indicator, the Domestic Trend Tracking Index (TTI-green line in the above chart) is now positioned above its long-term trend line (red) by +3.82% after having generated a new Domestic “Buy” signal effective 2/13/19 as posted.
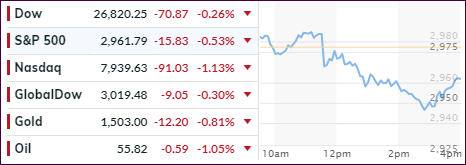
The markets were trading in
the red for most of the session, as the latest trade headlines pushed equities
further south and then gave traders hope that optimism is warranted.
When things looked bleak at
mid-day, Reuters managed to provide the algos with some ammo to drive the indexes
out of the doldrums and back up to their respective unchanged lines using the
following:
CHINA’S WANG YI SAYS HOPES BOTH SIDES CAN TAKE ‘MORE ENTHUSIASTIC MEASURES,’ REDUCE PESSIMISTIC LANGUAGE AND ACTIONS IN TRADE DISPUTE – RTRS
CHINA’S WANG YI SAYS ‘IF EVERYONE DOES THIS, TALKS WILL NOT ONLY RESUME, BUT WILL PROCEED AND YIELD RESULTS’
Despite that effort, the unchanged lines proved to be overhead resistance, and we sold off into the close, but with only modest losses.
Adding to the negative early
sentiment was the Trump Administration confirming that it’s “unlikely to extend
temporary wavers to supply Huawei.” That reinforced that the US-China trade
deal is simply not getting closer to an agreement, even though other headlines
attempt to prove that a deal is close.
Real Estate provided some
optimism when Pending Home Sales rose 2.48% YoY, which was the biggest annual
jump since April 2016, but it was simply not enough firepower to restore
bullish momentum.
The overnight liquidity shortage,
also known as the funding disaster, keeps getting worse with the Fed as lender
of last report supplying some $60 billion in liquidity after yesterday’s $92 billion.
No one has really come out to
explain the source of the problem and if it might be just a quarter ending
issue. MSM does not report about it, but somewhere the financial plumbing in
our system has sprung a leak.
One analyst posed the thoughts that have been on my mind as well:
It’s great that the Fed is pumping liquidity into the system, however, why were the existing operations insufficient?
As of today, the Fed had injected $105 billion in liquidity into the Repo market, but rates were still stubbornly high. Whatever changed last week to cause the funding spikes is clearly still a problem.
If this problem is not resolved quickly but spreads even further, equity markets will eventually be negatively affected.
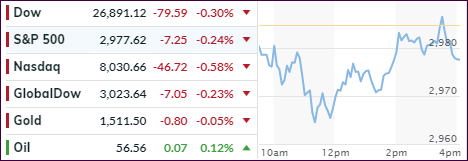
Early hopes, that successful
trade talks might be on deck during October, were dashed today when Trump criticized
China in no uncertain terms during his UN speech.
The result was that the early
rally shifted in reverse with the pullback accelerating and pushing the major
indexes deeper in the red. Things worsened
when Speaker Nancy Pelosi put some new lipstick on an old pig, namely impeachment
proceedings, which rattled traders and algos alike leaving the bears in charge
for this session.
Despite an afternoon attempt
to revive some bullish momentum, the damage was done, and the S&P 500 moved
further away from its psychologically important 3k milestone marker.
Not helping at all was the
latest report on Consumer Confidence showing the index falling to 125.1 from a
previous 134.2. Analysts were quick to point out that the trade tensions with
China were a contributing factor.
Even plunging bond yields, which
saw their biggest drop in a month, couldn’t do anything to counter the triple
whammy: Trump being negative on China, Consumer Confidence tumbling and impeachment
headlines.
On a personal note, I want to let you know that I will be out of the office all day tomorrow and won’t be able to write the market commentary. Regular posting will resume on Thursday.