
- Moving the markets
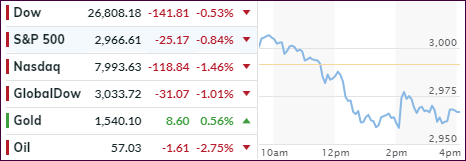
Early hopes, that successful trade talks might be on deck during October, were dashed today when Trump criticized China in no uncertain terms during his UN speech.
The result was that the early rally shifted in reverse with the pullback accelerating and pushing the major indexes deeper in the red. Things worsened when Speaker Nancy Pelosi put some new lipstick on an old pig, namely impeachment proceedings, which rattled traders and algos alike leaving the bears in charge for this session.
Despite an afternoon attempt to revive some bullish momentum, the damage was done, and the S&P 500 moved further away from its psychologically important 3k milestone marker.
Not helping at all was the latest report on Consumer Confidence showing the index falling to 125.1 from a previous 134.2. Analysts were quick to point out that the trade tensions with China were a contributing factor.
Even plunging bond yields, which saw their biggest drop in a month, couldn’t do anything to counter the triple whammy: Trump being negative on China, Consumer Confidence tumbling and impeachment headlines.
On a personal note, I want to let you know that I will be out of the office all day tomorrow and won’t be able to write the market commentary. Regular posting will resume on Thursday.
2. ETFs in the Spotlight
In case you missed the announcement and description of this section, you can read it here again.
It features 10 broadly diversified and sector ETFs from my HighVolume list as posted every Saturday. Furthermore, they are screened for the lowest MaxDD% number meaning they have been showing better resistance to temporary sell offs than all others over the past year.
The below table simply demonstrates the magnitude with which some of the ETFs are fluctuating regarding their positions above or below their respective individual trend lines (%+/-M/A). A break below, represented by a negative number, shows weakness, while a break above, represented by a positive percentage, shows strength.
For hundreds of ETF choices, be sure to reference Thursday’s StatSheet.
For this current domestic “Buy” cycle, here’s how some our candidates have fared:
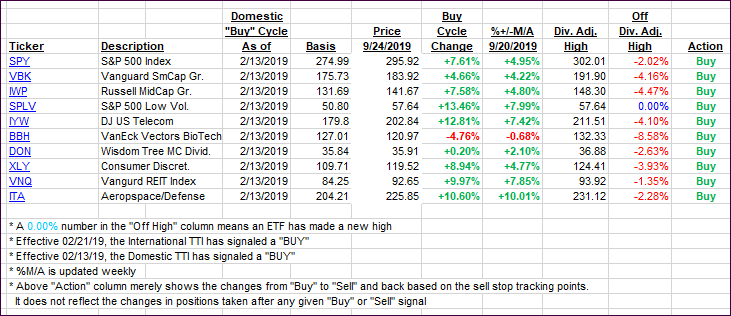
Again, the %+/-M/A column above shows the position of the various ETFs in relation to their respective long-term trend lines, while the trailing sell stops are being tracked in the “Off High” column. The “Action” column will signal a “Sell” once the -8% point has been taken out in the “Off High” column. For more volatile sector ETFs, the trigger point is -10%.
3. Trend Tracking Indexes (TTIs)
Our Trend Tracking Indexes (TTIs) headed south, as bullish momentum was conspicuously absent during today’s session.
Here’s how we closed 09/24/2019:
Domestic TTI: +3.45% above its M/A (prior close +4.33%)—Buy signal effective 02/13/2019
International TTI: +1.40% above its M/A (prior close +1.88%)—Buy signal effective 09/12/2019
Disclosure: I am obliged to inform you that I, as well as my advisory clients, own some of the ETFs listed in the above table. Furthermore, they do not represent a specific investment recommendation for you, they merely show which ETFs from the universe I track are falling within the specified guidelines.
Contact Ulli